Lake County, Tennessee, in the Heart of the New Madrid Seismic Zone
 Taylor Weathers
 Roy Van Arsdale
- Department of Earth Sciences, University of Memphis, Memphis, TN, United States
Lake County, Tennessee, lies within the center of the New Madrid seismic zone, and thus is particularly vulnerable to seismic hazards. To better evaluate the seismic threat to Lake County, the stratigraphy and structure were mapped beneath the county. A shallow 3-D lithologic model was constructed to illustrate the Quaternary Mississippi River alluvial facies of Lake County in five-foot (1.5 m) thick layers to a depth of 300 feet (91.4 m). This model provides near-surface geologic data for the determination of earthquake liquefaction potential and illustrates the Mississippi River alluvial aquifer for optimum agricultural water exploitation. In addition, faulted structure contour maps were made of the tops of the unconformable Paleozoic, Cretaceous, and Eocene sections. With these structure contour maps a deep 3-D geologic model was built for Lake County, which shows the stratigraphy and structure from the Quaternary to the Paleozoic. Cross-sections were also created to illustrate the subsurface geology. The faulted structure contour maps and cross-sections reveal Quaternary faulting on the Reelfoot North, Axial, Tiptonville dome back thrust, Lake County uplift back thrust, Cottonwood Grove, Ridgely, and previously unidentified faults. The maps also illustrate where surface fault rupture may occur and the sense of vertical surface displacement in the event of a future large earthquake.
Introduction
The New Madrid seismic zone (NMSZ), located in the central Mississippi River Valley, is known for its historically devastating earthquakes of 1811–1812 and its continued seismicity (Figure 1; Penick, 1981; Csontos and Van Arsdale, 2008). Lake County is a small, rural, county in northwestern Tennessee (Figure 1). The entire county is located within the Mississippi River flood plain and overlies the northwest-striking Reelfoot North and Reelfoot South reverse faults and the northeast-striking, right-lateral transpressive Axial, Cottonwood Grove, and Ridgely faults (RFs) (Figures 1–3; Johnston and Schweig, 1996; Csontos and Van Arsdale, 2008). Uplift of the Reelfoot North and Reelfoot South faults (RSFs) and coincident subsidence of the Reelfoot Lake basin was responsible for the creation of Reelfoot Lake by the temporary damming and permanent local ponding of the Running Reelfoot River (Stahle et al., 1992). Over a larger area, the Tiptonville dome and Ridgely ridge were uplifted as part of the Lake County uplift (LCU) (Figure 2; Russ, 1982; Purser, 1996; Purser and Van Arsdale, 1998; Csontos and Van Arsdale, 2008; Csontos et al., 2008; Van Arsdale, 2009). All of Lake County and much of the surrounding region is covered by sand blow deposits due to 1811–1812 earthquake liquefaction that most graphically depicts this earthquake hazard. Microseismicity is ongoing with the threat of future large magnitude earthquake ground shaking and liquefaction remaining an ever-present concern for the county.
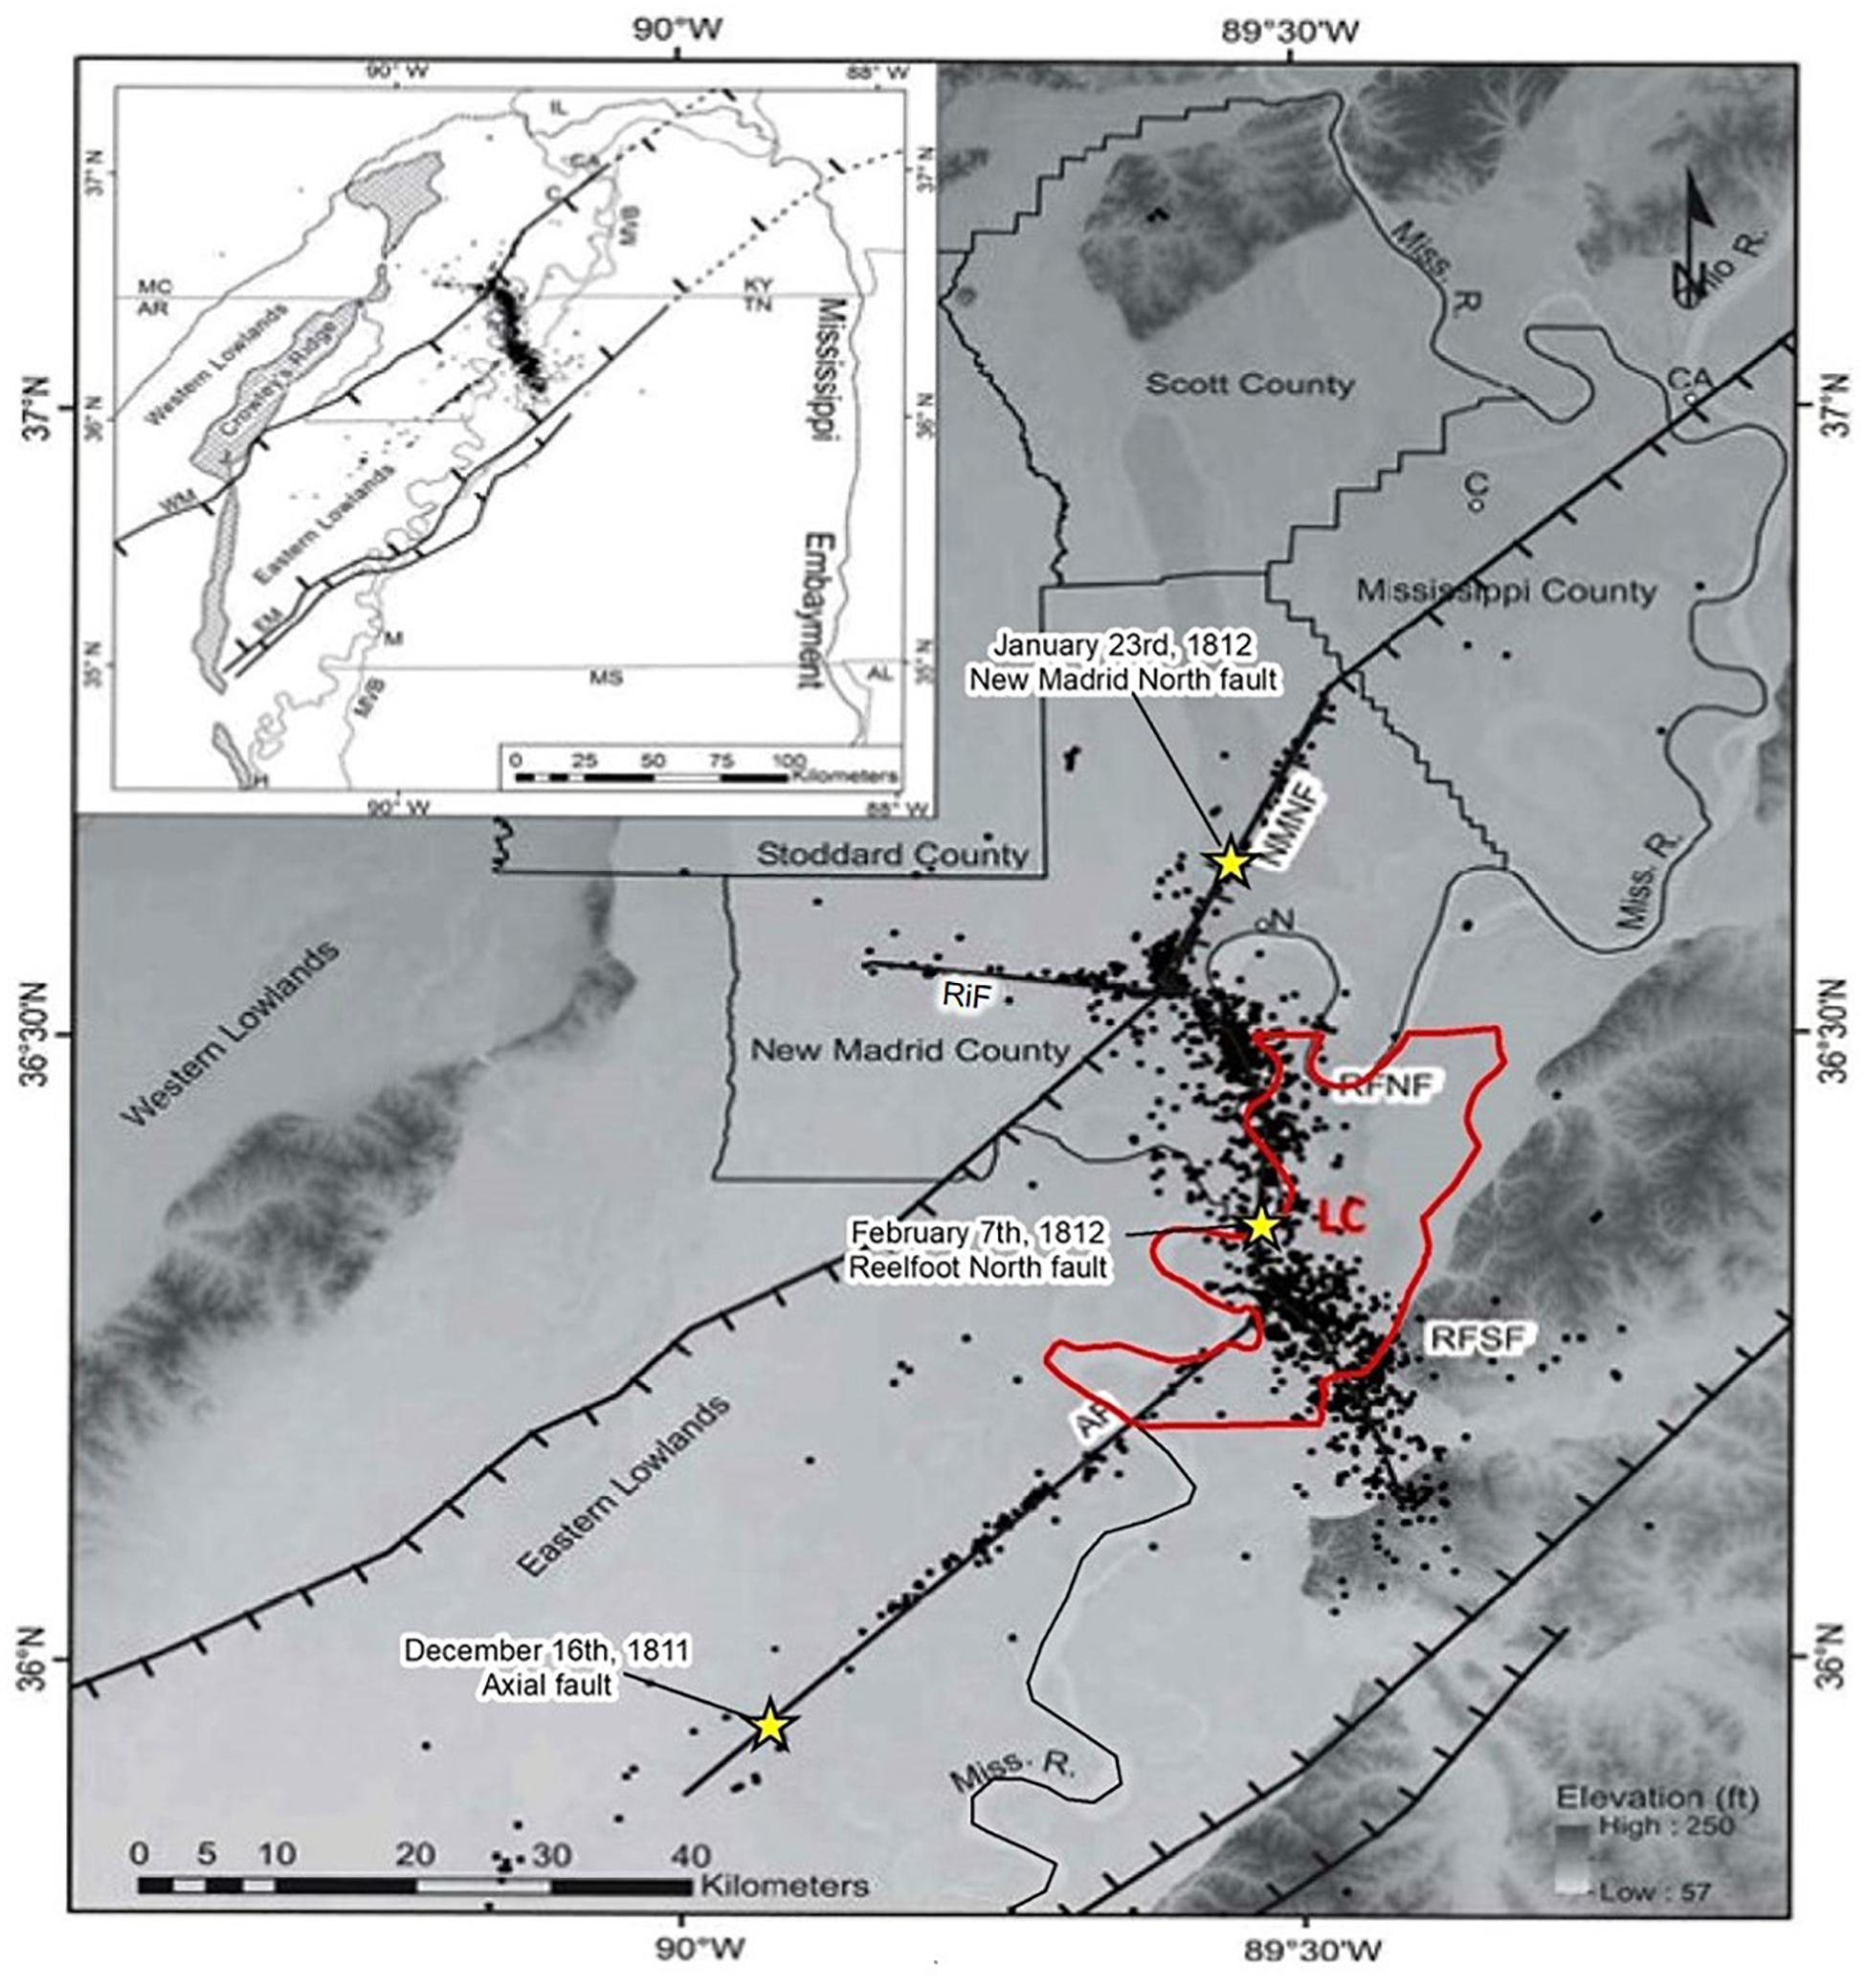
Figure 1. Earthquakes recorded between 1979 and 2006 in the New Madrid seismic zone (CERI Earthquake Catalog) are illustrated as black dots, with the approximate locations of the three very large 1811–1812 earthquakes as stars. LC, Lake County; AF, Axial fault; CA, Cairo, Illinois; C, Charleston, Missouri; N, New Madrid, Missouri; NMNF, New Madrid North fault; RiF, Risco fault (New Madrid West fault); RFNF, Reelfoot North fault; and RFSF, Reelfoot South fault. Inset box shows Mississippi embayment and Mississippi River valley area. EM, Eastern Reelfoot rift margin; H, Helena, Arkansas; M, Memphis, Tennessee; MVB, Mississippi River valley bluffs; WM, Western Reelfoot rift margin. The inset map also shows the New Madrid seismic zone of northwest Tennessee, southeast Missouri, and northeast Arkansas within the northern Mississippi embayment [modified from Pryne et al. (2013)].
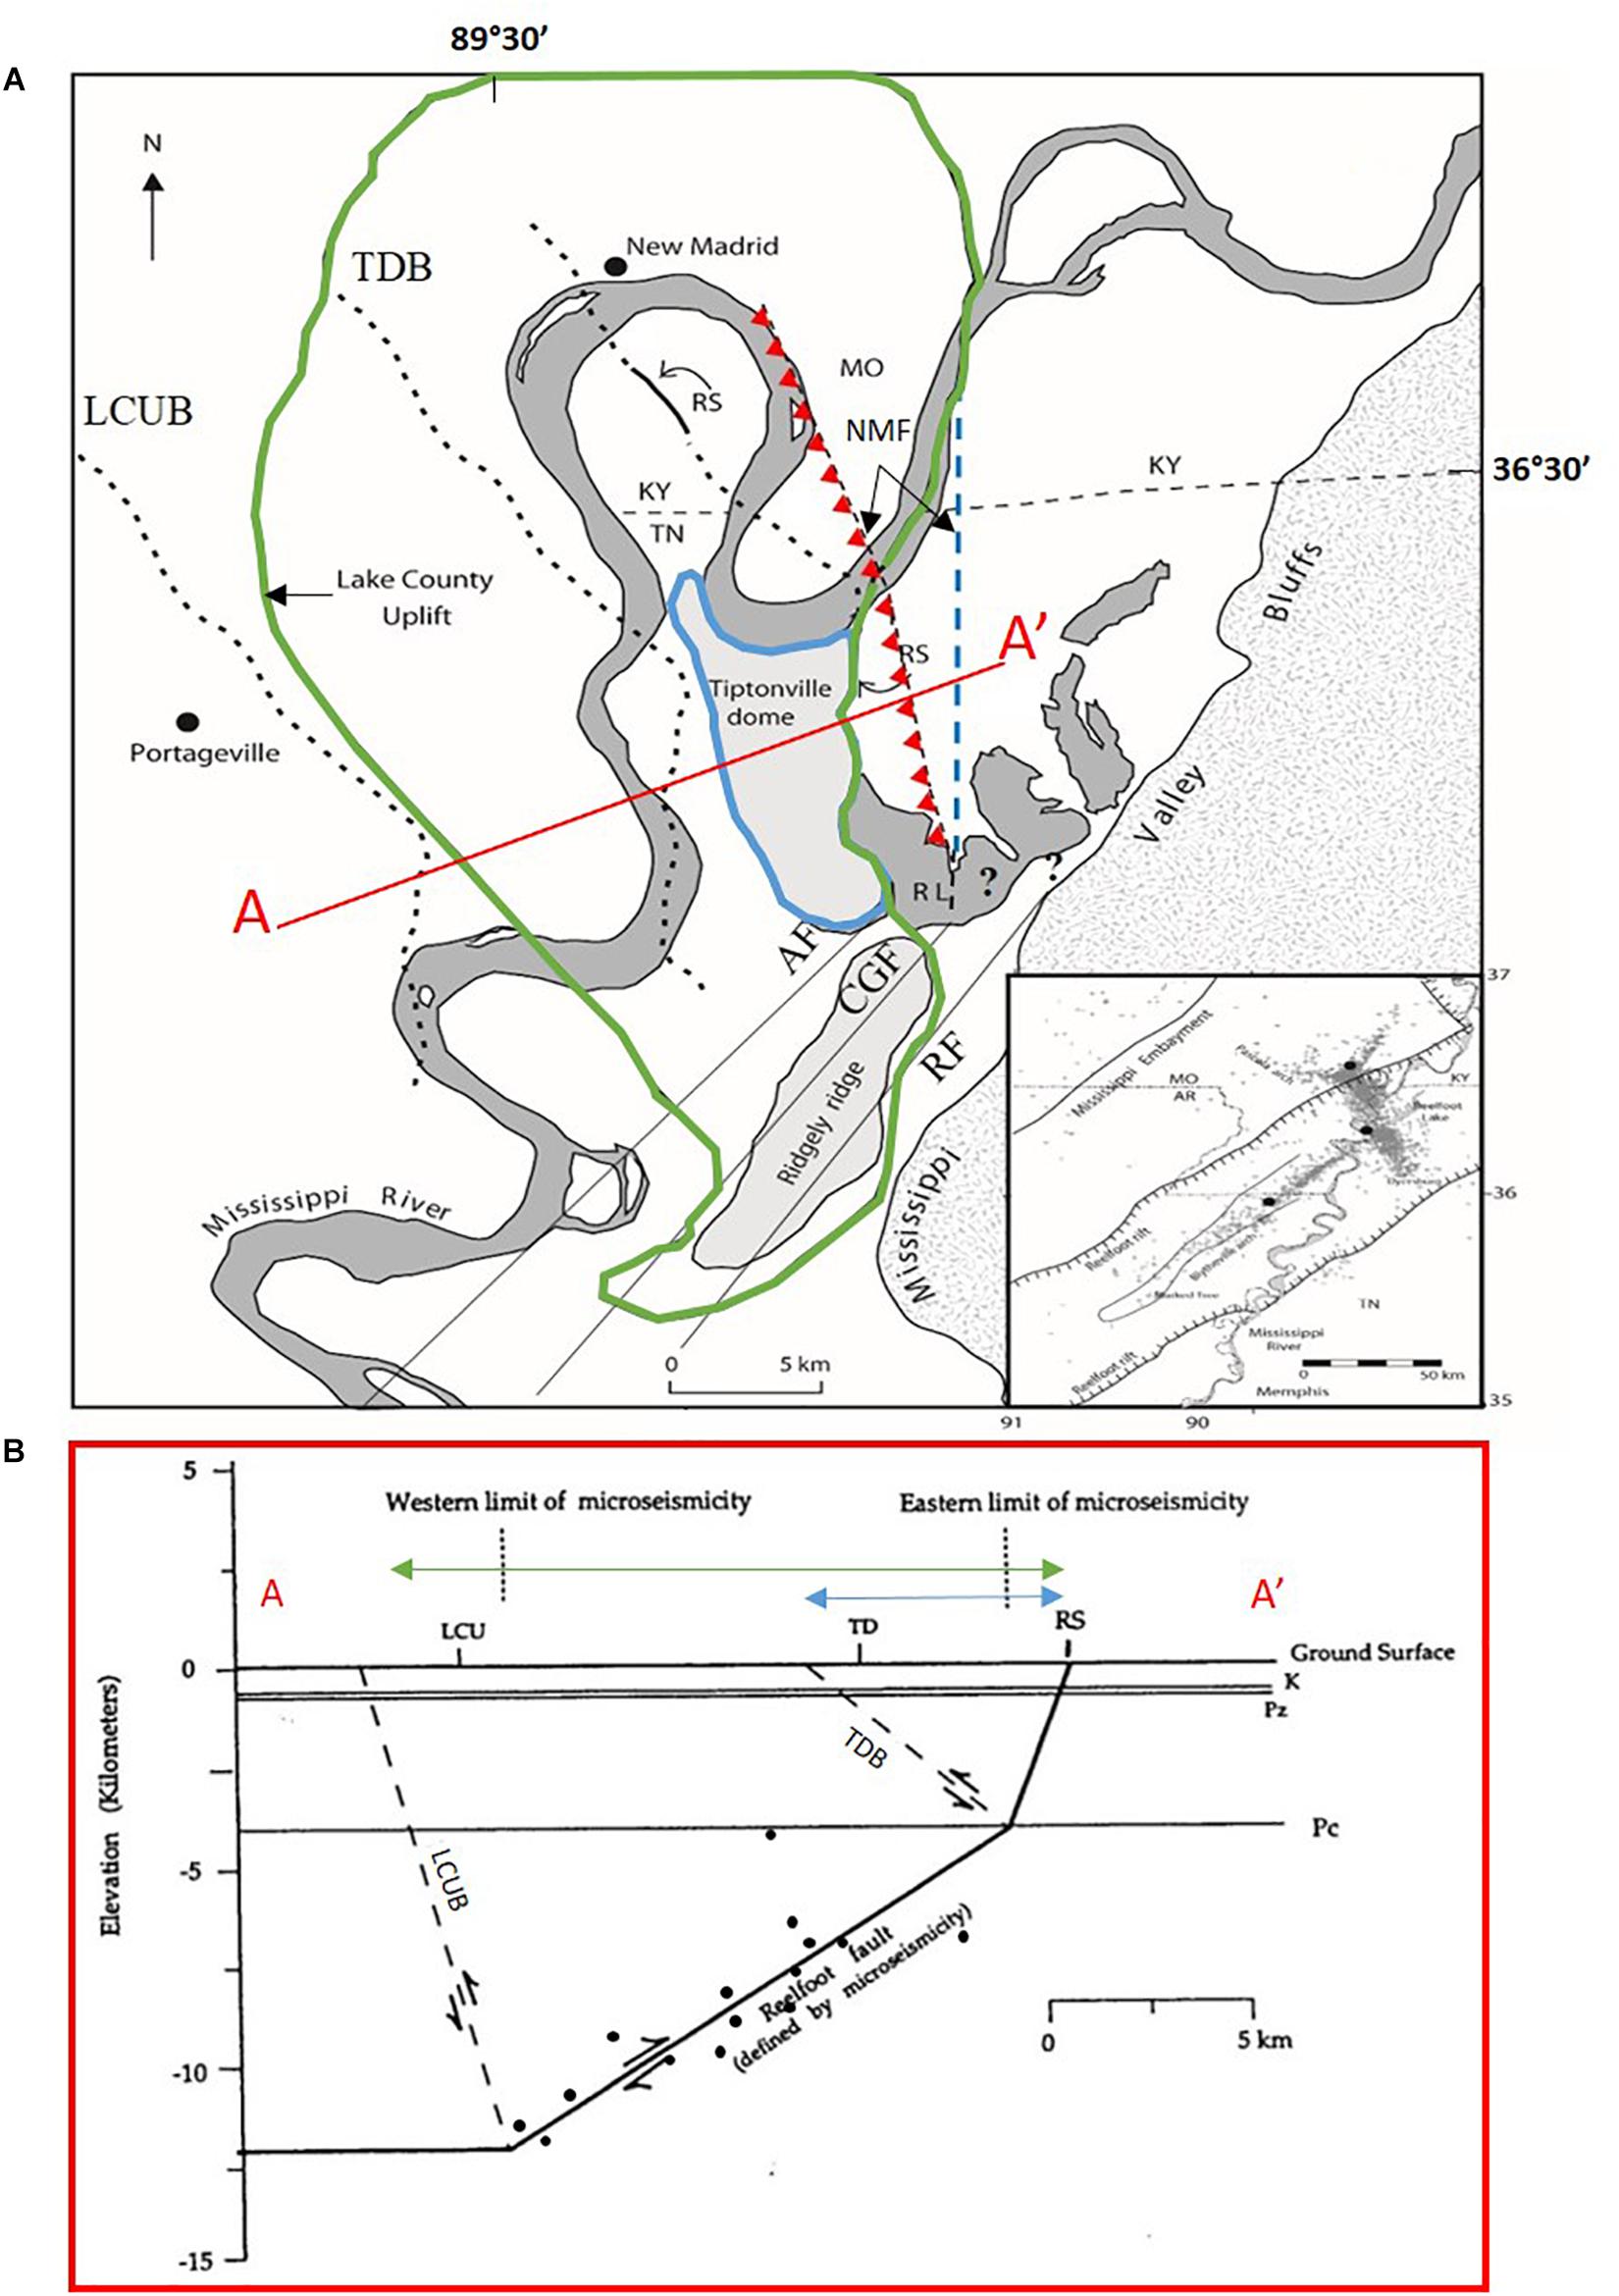
Figure 2. (A) Map of the major faults and structures of Lake County area. This includes the Lake County uplift (green perimeter) and its proposed west-bounding back thrust (dashed, LCUB), the northwest-trending Tiptonville dome (blue perimeter) and its proposed west-bounding back thrust (dashed, TDB), and the east-facing Reelfoot scarp monocline (RS) along the Reelfoot reverse fault, which bounds the Tiptonville dome and locally Reelfoot Lake (RL). Also shown is the southwest-trending Ridgely ridge bounded on the west by the Cottonwood Grove fault (CGF) and on the east by the Ridgely fault (RF). Axial fault (AF) is shown to the west of Ridgely ridge. New Markham fault (NMF) interpreted by Guo et al. (2014) (red barbed dashed-line) and original interpretation by Odum et al. (1994, 1998) and Van Arsdale et al. (1998) (blue dashed-line). Small inset map shows NMSZ (Johnston, 1996) [modified from Purser and Van Arsdale (1998)]. (B) Geologic cross-section of Lake County illustrating the deep structure and the 32° dipping fault plane within the Precambrian rock along which most earthquakes occur. The NMF is not shown in this cross-section. Earthquake hypocenters (dots along Reelfoot fault) from Figure 2J of Mueller and Pujol (2001).
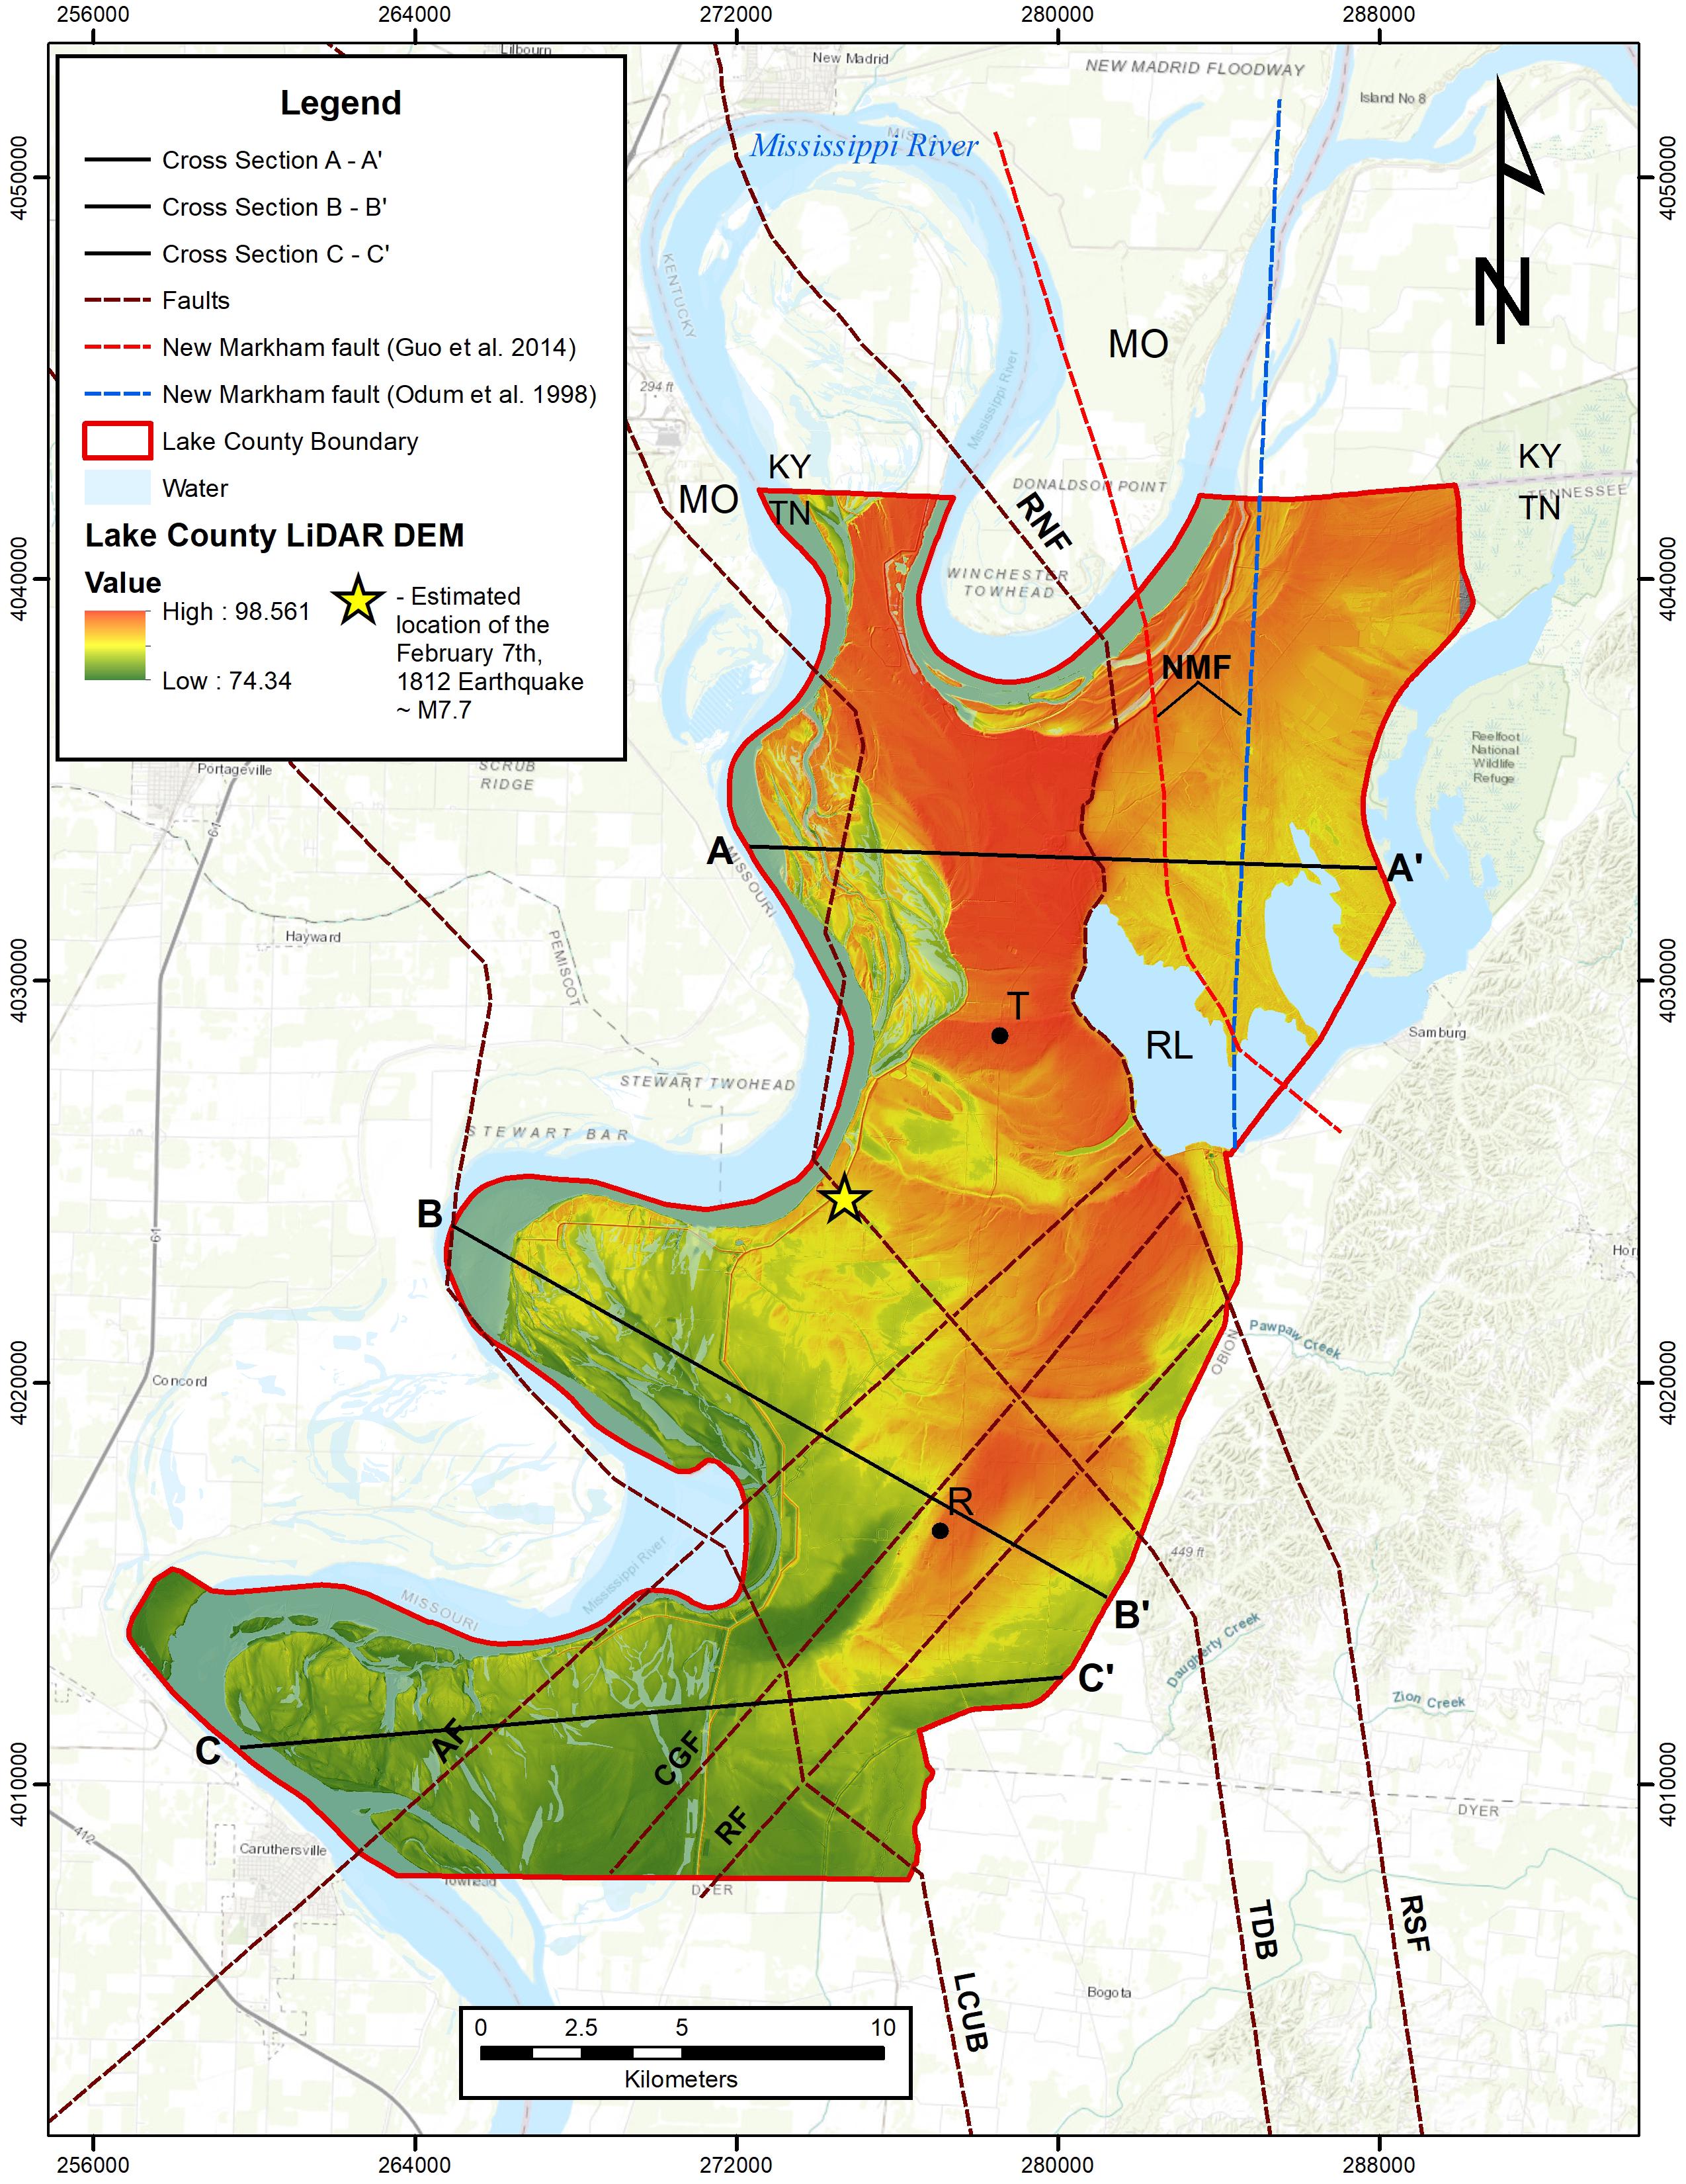
Figure 3. Lake County, Tennessee with locations of Cross-Sections A-A’, B-B’, and C-C’. Red (NMF) and blue (NMF) dashed lines represent Guo et al. (2014) and Odum et al. (1998) interpreted locations of the NMF, respectively. Brown dashed lines represent previously interpreted faults. T, Tiptonville; R, Ridgely; RL, Reelfoot Lake; AF, Axial; CGF, Cottonwood Grove; RF, Ridgely; RNF, Reelfoot North; RSF, Reelfoot South; TDB, Tiptonville dome back thrust; LCUB, Lake County uplift back thrust faults; KY, Kentucky; MO, Missouri; TN, Tennessee.
New Madrid Seismic Zone and Its Earthquakes
The New Madrid Seismic Zone is an intraplate seismic zone located in the central Mississippi River valley and is responsible for three ≥M 7.3 earthquakes (Figure 1) in the winter months of 1811–1812 that violently shook the region and were felt along the east coast of the United States (Fuller, 1912; Johnston and Schweig, 1996; Van Arsdale, 2009; Cramer and Boyd, 2014). On December 16, 1811 the ∼M 7.5 earthquake occurred on the northeast-striking, dextral strike-slip axial fault (AF) near the city of Blytheville, Arkansas (Figure 1; Johnston and Schweig, 1996). The January 23, 1812 ∼M 7.3 earthquake occurred on the northeast-striking, dextral, strike-slip New Madrid North fault (NMNF) near New Madrid, Missouri. On February 7, 1812 an estimated M 7.7 earthquake occurred on the northwest-striking Reelfoot North and Reelfoot South reverse faults near Tiptonville, Tennessee (Cramer and Boyd, 2014). In 1811–1812 few people lived in the region, but contemporary journal entries, regional newspapers, and eyewitness accounts speak of the profound earthquake effects (Penick, 1981). Sand blows and fissures tore up the landscape, with some sand blows ejecting sand and water to the tops of trees (∼100 ft – 30.5 m) and releasing a sulfurous odor. Mississippi River banks collapsed, landslides occurred along the eastern Mississippi River bluffs, and cabins were damaged or destroyed (Fuller, 1912; Penick, 1981). Similar conditions today would cause catastrophic damage and significant loss of life in the central Mississippi River Valley (CMRV).
The New Madrid earthquakes of 1811–1812 caused severe regional liquefaction. However, there is also evidence for earlier liquefaction events from prehistoric earthquakes occurring within the NMSZ (Saucier, 1987, 1994; Obermeier, 1988, 1989; Rodbell and Bradley, 1993; Rodbell, 1996; Tuttle et al., 1999, 2002, 2005, 2019; Wolf et al., 2006). Thus, liquefaction potential is a major concern in the Mississippi River flood plain and its major tributaries. Dhar and Cramer (2017) developed probabilistic and deterministic liquefaction hazard maps for the northern Mississippi embayment and note that the Quaternary deposits in the Eastern Lowlands (Figure 1) have the highest chances of experiencing widespread liquefaction if another ≥M 7.0 earthquake were to occur.
Geologic History of the Central Mississippi River Valley
Figure 4 shows a stratigraphic column for the CMRV and is appropriate for Lake County. Precambrian crystalline basement rock of the Eastern Granite-Rhyolite Province (1.47 Ga) underlies the present-day region of the CMRV (Van Schmus et al., 2007; Van Arsdale, 2009). The N45°E – striking Reelfoot rift (Figure 1) is a rift system that formed within the crystalline basement during the early Cambrian (Hildenbrand et al., 1982; Hildenbrand, 1985; Dart and Swolfs, 1998; Csontos et al., 2008; Chen et al., 2014). Paleozoic rocks overlying the Reelfoot rift consist of the Lower to Upper Cambrian Potsdam Megagroup and are divided into the basal Lamotte sandstone, ascending to the Bonneterre dolomite, and the Elvin shale (Figure 4; Howe and Thompson, 1984; McKeown et al., 1990). Upper Cambrian to Lower Ordovician strata of the undifferentiated Knox Megagroup immediately overlie the Potsdam Megagroup (Howe and Thompson, 1984; Howe, 1985; McKeown et al., 1990; Nelson and Zhang, 1991; Lumsden and Caudle, 2001). The Paleozoic Era concluded in the region with the formation of the Appalachian-Ouachita orogenic belt (Thomas, 1988, 1989, 2006). The Appalachian-Ouachita mountain belt was erosionally breached during the Middle Cretaceous when the North American plate drifted over the Bermuda hotspot (Cox and Van Arsdale, 1997, 2002; Van Arsdale and Cox, 2007). Thermal uplift occurred when the Bermuda hotspot was under the Mississippi River Valley, which caused the rejuvenation of the Reelfoot rift basement faults and pluton intrusion. The Late-Cretaceous uplift led to the development of the Late Cretaceous unconformity. Subsequently, Late Cretaceous thermal subsidence occurred when the CMRV moved off the hotspot, resulting in the inundation of the landscape by the Gulf of Mexico to form the Mississippi embayment.
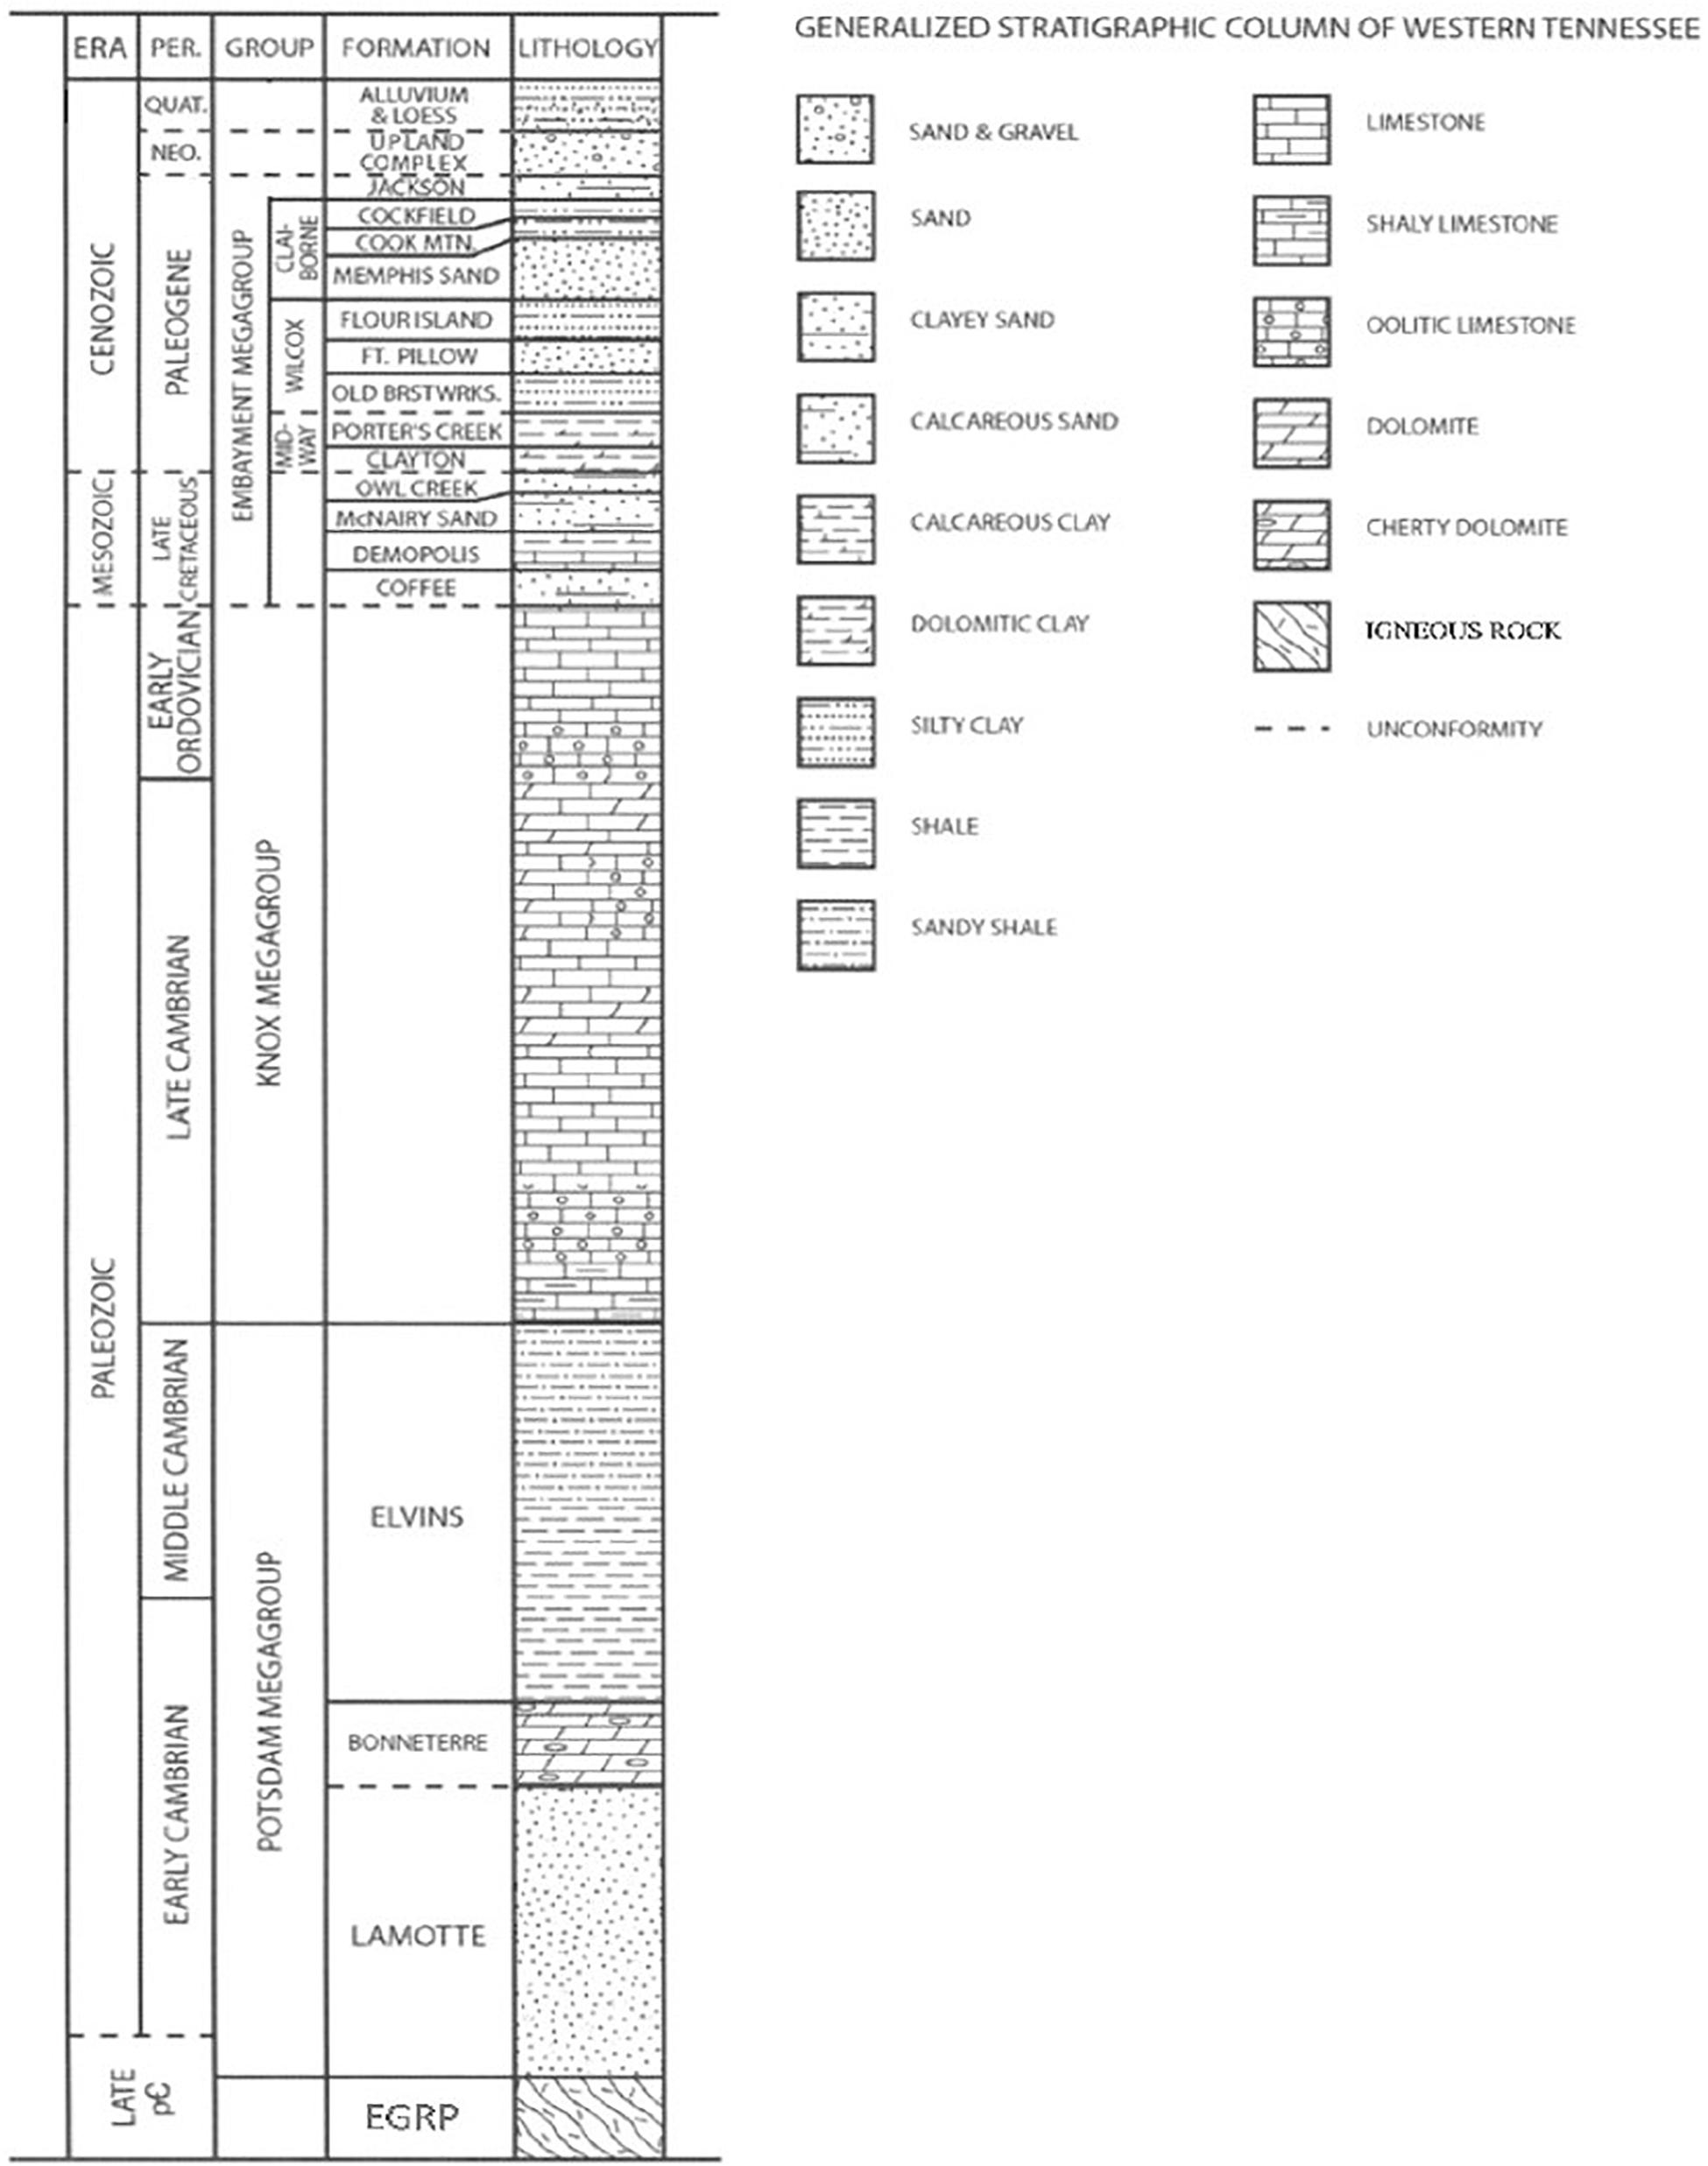
Figure 4. Generalized stratigraphic column of West Tennessee. Quat., Quaternary; Neo., Neogene; EGRP, Eastern Granite-Rhyolite Province [modified from Parrish and Van Arsdale (2004) and Ward (2016)].
Lake County lies within the Mississippi embayment (Figure 1 inset), a southwest-plunging erosional trough filled with Late Cretaceous and Paleogene sediments (Cushing et al., 1964; Crone, 1981; Cox and Van Arsdale, 1997, 2002; Van Arsdale and TenBrink, 2000; Martin and Van Arsdale, 2017). From the Late Cretaceous through the Paleogene, the region underwent marine transgression and regression cycles. Late Cretaceous shallow-marine to fluvial-deltaic deposits, consisting of marls, chalk, clays, sands, and minor lignite, unconformably overlie the Paleozoic. These units include the Coffee Formation, Demopolis Formation, Coon Creek Formation, McNairy Sand, and Owl Creek Formation (Figure 4). The Coffee Formation, Demopolis Formation, and Coon Creek Formations are thin or missing beneath Lake County (Crone, 1981). Paleogene marine to fluvial-lacustrine sediments overlie the Late Cretaceous sediments (Martin and Van Arsdale, 2017). The Paleogene units consist of the Paleocene Midway Group, the Eocene Wilcox and Claiborne Groups, and the Eocene-Oligocene Jackson Formation. The Midway Group contains the nearshore shallow-marine Clayton Formation and the overlying marine Porters Creek Clay. The overlying Wilcox Group contains predominantly nearshore shallow-marine sediments and includes the Old Breastworks Formation, the Fort Pillow Sand, and the Flour Island Formation. Locally, the Old Breastworks Formation is thin or missing. The Claiborne Group contains the fluvial Memphis Sand, which is the primary aquifer in western Tennessee and adjacent states (Larsen and Brock, 2014; Martin and Van Arsdale, 2017), the lacustrine or shallow-marine Cook Mountain Formation, and the deltaic Cockfield Formation (Crone, 1981; Martin and Van Arsdale, 2017). The overlying Jackson Formation is interpreted to be a fluvial-lacustrine dominated deposit, but some interpret the Jackson Formation to have been the last major marine transgression in the northern Mississippi embayment (Cushing et al., 1964; Crone, 1981; Saucier, 1994). The Jackson Formation is exposed along the Mississippi River bluffs immediately east of Lake County (Cushing et al., 1964). Within Lake County the Jackson Formation may be locally absent due to erosional scouring by the Mississippi River and due to the difficulty in differentiating the Jackson and Cockfield formations (Crone, 1981; Frederiksen et al., 1982). The northern Mississippi embayment also contains the (∼3.2 Ma) Pliocene Upland Complex [originally called the Lafayette Gravel by Potter (1955a, b)], which is a high-level fluvial terrace deposit of the ancestral Mississippi River system (Autin et al., 1991; Saucier, 1994; Potter, 1955a,b; Van Arsdale et al., 2007, 2014a,b, 2019; Van Arsdale and Cupples, 2013; Cupples and Van Arsdale, 2014; Cox et al., 2014; Lumsden et al., 2016). No Upland Complex is preserved in Lake County due to erosion by the Quaternary Mississippi River, but it is preserved immediately to the east within the Mississippi River bluffs (Figure 2). Quaternary deposits adjacent to Lake County include Pleistocene fluvial, lacustrine, and eolian deposits as well as Holocene fluvial deposits. Fluvial deposits of the Pleistocene consist primarily of braid belt terrace deposits (Saucier, 1994; Rittenour et al., 2007; Csontos et al., 2008; Cupples and Van Arsdale, 2014; Ward et al., 2017). Pleistocene lacustrine deposits are locally found along the Mississippi River bluffs and Mississippi River tributaries (Saucier, 1987, 1994; Grimley et al., 2009). Pleistocene loess accumulated in the uplands of the Mississippi River east of Lake County (Markewich et al., 1998, 2011; Pigati et al., 2015). Holocene sediments of the Mississippi River flood plain include overbank clay and silt, natural levee sand, crevasse splay sand and silt, point bar sand, and fluvial channel sandy gravel deposited in meander scrolls (Cushing et al., 1964; Crone, 1981; Saucier, 1987, 1994; Guccione et al., 2002; Csontos and Van Arsdale, 2008; Van Arsdale, 2009; Weathers, 2019).
Faulting and Seismicity Within the NMSZ and Lake County
Several faults have been mapped in and adjacent to Lake County (Figures 1–3). The AF is a near-vertical NE-striking, dextral, strike-slip fault that is the southwestern arm of the NMSZ (Johnston and Schweig, 1996; Csontos and Van Arsdale, 2008; Csontos et al., 2008; Magnani and McIntosh, 2009; Guo et al., 2014; Magnani et al., 2017). The AF is believed to be responsible for the December 16th, 1811 ∼M 7.5 earthquake (Cramer and Boyd, 2014) and bisects the Reelfoot reverse fault into two segments; the Reelfoot North fault and the RSF (Figure 1). Guo et al. (2014) interpret 20 – 25 m of vertical displacement at the base of the Quaternary alluvium across the AF thus indicating transpression. Woolery and Almayahi (2014) suggest the AF continues to the northeast into Kentucky. The northernmost segment of the NMSZ is a near-vertical, NE-striking, dextral, strike-slip fault known as the NMNF (Figure 1; Pryne et al., 2013) that is thought to be responsible for the January 23rd, 1812 ∼M 7.3 New Madrid earthquake. The Risco fault (RiF) is identified as a west-striking, left-lateral, strike-slip fault from earthquake foci information (Csontos et al., 2008; Figure 1). The Reelfoot North fault and the RSF strike northwest (Csontos and Van Arsdale, 2008; Van Arsdale et al., 2013; Boyd et al., 2015). Both faults dip 72° southwest from the shallow subsurface to a depth of ∼ 4 km. However, below 4 km, within the Precambrian section, the Reelfoot North fault dips 32° SW (Figure 2) and the RSF dips 44° SW (Csontos and Van Arsdale, 2008). The Reelfoot scarp is a fault-propagation fold of the deeper Reelfoot North and Reelfoot South fault expressed at the surface as a down-to-the-northeast monocline. This monocline bounds the eastern margin of the Tiptonville dome/Lake County uplift and the western margin of the Reelfoot Lake basin (Figure 2). The 10 to 14 km deep 32°-dipping Reelfoot fault within Precambrian rock is the location of much of the seismicity of the NMSZ (Chiu et al., 1992; Stephenson et al., 1995; Van Arsdale et al., 1995, 1998; Purser and Van Arsdale, 1998; Mueller and Pujol, 2001; Guccione et al., 2002; Csontos and Van Arsdale, 2008; Csontos et al., 2008). Hanging wall deformation above the Reelfoot fault uplifted the LCU and Tiptonville dome (TD) (Figure 2). The LCU/TD is a fault-bounded topographic uplift with up to 11 m of structural relief across the Reelfoot scarp monocline.
There are three primary uplifted structures beneath Lake County: LCU, Tiptonville dome, and Ridgely ridge (Russ, 1982; Stephenson et al., 1995; Purser and Van Arsdale, 1998). Stephenson et al. (1995) mapped the Cottonwood Grove and RFs in the subsurface and illustrated that these faults bound Ridgely ridge to the west and east, respectively (Figure 2). Stephenson et al. (1995) also interpret the RF to be a near-vertical northeast-striking, right-lateral, transpressive strike-slip fault with numerous splays and small horst blocks. The RF vertically displaces the top of the Paleozoic unconformity ∼ 24 m and Paleogene units ∼ 20 m. The Cottonwood Grove fault (CGF) is also a northeast-striking, right-lateral, transpressive strike-slip fault with 30 m of displacement on the tops of the Paleozoic and Cretaceous. Guo et al. (2014) interpret the base of the Quaternary to be displaced ∼ 20 to 25 m by the CGF. Both faults are responsible for the uplift of Ridgely ridge, which in the landscape is ∼ 5 m higher than the surrounding Mississippi River flood plain (Stephenson et al., 1995). The Cottonwood Grove and RFs parallel the strike and near-vertical dip of the AF but are currently not seismic.
A seismic reflection survey along the southern margin of Reelfoot Lake imaged the RSF, the CGF, and RF (Van Arsdale et al., 1998). The RSF displaces the top of the Paleozoic by 70 m, Cretaceous by 60 m, Midway Group by 40 m, Wilcox Group by 30 m, and the Eocene/Quaternary unconformity by 15 m (Van Arsdale et al., 1998). To the southeast, adjacent to the Mississippi River bluffs, the RSF displaces the top of the Paleozoic 65 m, Cretaceous 40 m, Midway Group 31 m, Wilcox Group 20 m, and Memphis Sand 16 m (Greenwood et al., 2016). Greenwood et al. (2016) argue that the RSF is not offset by the CGF or RF. Displaced Quaternary stream terraces and displacement of the Upland Complex within the Mississippi River bluffs just to the east of Lake County in Obion County signify that the RSF and Tiptonville dome continue southeast into Obion County (Greenwood et al., 2016).
Odum et al. (1994, 1998) conducted a seismic reflection survey along highway 78 northeast of Tiptonville and interpreted the New Markham fault (NMF). They interpreted the NMF as a north-striking, dextral, strike-slip fault, which they projected to trend south from the northeastern margin of the LCU into Reelfoot Lake where a scarp (possible fault scarp) at the bottom of Reelfoot Lake may connect the NMF and the CGF. Purser and Van Arsdale (1998), and Van Arsdale et al. (1998) also suggest that the two faults may connect as a single fault (Figure 2). Guo et al. (2014) offer a different interpretation based on their Mississippi River seismic profile in which the NMF is further to the west and may be a splay (reverse fault) of the master Reelfoot fault (Figure 2). Guo et al. (2014) also suggest that the NMF is parallel to the Reelfoot scarp and that it displaces units from the Paleozoic to the Paleogene and possibly into the Quaternary.
This research was conducted to map the surface and subsurface geology of Lake County, Tennessee (Figures 1–3) that was subsequently incorporated into Lake County seismic hazard and liquefaction potential maps (Cramer et al., 2018b). The geologic maps and 3-dimensional geologic models of Lake County presented here provide, (1) a better understanding of the subsurface geology, (2) data for earthquake liquefaction potential mapping, (3) locations of subsurface faults and their sense of displacement, (4) sediment thicknesses necessary for earthquake ground shaking models, and (5) Mississippi River flood plain facies maps that illustrate where shallow agricultural water wells would produce high yield.
Materials and Methods
Data Collection
We herein summarize the methods used in this study with more detail available in Weathers (2019). Lithological logs from Lake County, and within a 4-km wide perimeter zone, were collected from the Tennessee Department of Environmental Conservation (TDEC), the Tennessee Department of Transportation (TDOT), the United States Army Corps of Engineers (USACE), and the Center of Applied Earth Science and Engineering Research (CAESER). Lithologic logs from the North American Coal Company, housed in CAESER, are lignite exploration logs. The 70 lignite exploration logs record lithologic information for depths up to 300 ft (∼ 91 m). Additional lithologic logs used in this study include 116 boring logs along the levees (USACE), 10 boring logs for bridges, railroads, and highways (TDOT), 4 boring logs of municipal water wells, 129 boring logs for irrigation and residential wells (TDEC), and 11 petroleum exploration well logs housed in CAESER. The boring depths vary; 30 –200 ft (9 –61 m) for USACE borings, 30 – 100 ft (9 – 30 m) for TDOT, 60 – 120 ft (18 – 37 m) for TDEC residential and irrigation wells, TDEC municipal well depths 700 – 800 ft (213 – 244 m), and 1800–3000 ft (549 – 914 m) petroleum exploration well depths.
Elevations of stratigraphic tops from seismic reflection surveys were included from publications by Purser and Van Arsdale (1998), Van Arsdale et al. (1998), Csontos and Van Arsdale (2008), Guo et al. (2014), and Greenwood et al. (2016). When elevations of stratigraphic tops in a seismic reflection line were not in a publication, conversions from two-way travel times were conducted using published interval velocities (Table 1).
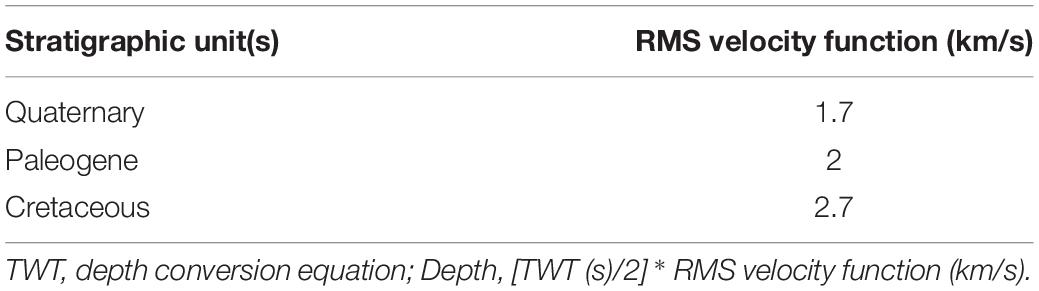
Table 1. Interval velocities of the Quaternary, Paleogene, and Cretaceous sections and depth conversion equation (Guo et al., 2014; Guo, personal comm. 2018).
Data Interpretation and Entry
Stratigraphic picks were made from the lithologic well logs and published seismic reflection data. Within the Quaternary Mississippi River flood plain section, maps were made at 5 ft (∼ 1.5 m) depth intervals. Elevations of the tops of the Eocene, Late Cretaceous, and Paleozoic strata were also compiled (Weathers, 2019).
Surface elevations of the borings and seismic line shot points were extracted from a LiDAR-sourced digital elevation model (DEM) (Figure 3). The DEM was created in Global Mapper 18.2 and was exported as ASCII files into ArcMap 10.3.1. The latitude and longitude of each boring and seismic shot point were recorded in Decimal Degrees (WGS 1984) and then converted into Universal Transverse Mercator (UTM) to construct geometrically accurate (horizontal and vertical in meters) 3-D projections of the subsurface geology.
Structure Contour Maps
Structure contour maps were made of the tops of the Eocene, Late Cretaceous, and Paleozoic sections. Unfaulted structure contour maps were created in ArcMap 10.3.1 using the Natural Neighbor interpolation method, which allows for smooth, geologically reasonable, contouring and for the absence of “bullseye” artifacts seen in other interpolation methods (Pryne, 2012). Faulted structure contour maps were then made of these surfaces using the Spline with Barriers interpolation method, which allows for the introduction of faults. Spline with Barriers provides interpolated amounts of vertical displacement along the fault break lines. Surfaces (e.g., top of the Paleozoic) are effectively split into separate fault-bounded gridded blocks and contoured. Previous investigators have documented displacement of the tops of the Paleozoic, Cretaceous, and Eocene units in Lake County. Insertion of the faults in our structure contour maps better illustrates the displacement of these surfaces, uses the technique to identify undocumented faults, and indicates which faults appear to have displaced Quaternary sediment.
Cross-Sections
Cross-sections were made from stacked structure contour maps in ArcMap. This software creates cross-sections based on manually entered parameters such as the search distance of borings from a cross-section line and vertical exaggeration. Cross-sections illustrate the Quaternary, Paleogene, Cretaceous, and top of the Paleozoic.
Lake County 3-Dimensional Geologic Model of the Mississippi River Quaternary Alluvium
A surface geologic map and 3-D Model of the uppermost 300 ft (∼100 m) was made from 336 lithologic logs to illustrate the Quaternary Mississippi River alluvial deposits beneath Lake County. The model consists of 5 ft (1.5 m) depth intervals that show the lateral distribution of the alluvial sediments within that 5 ft (1.5 m) slice (Pryne et al., 2013; Weathers, 2019). Sediment types were assigned a numerical value within Excel 2016 with gravel as value “0” to clay as value “6” (Table 2). Eocene sediments were assigned a value of “7.” A spreadsheet containing the data was imported into ArcMap 10.3.1 for map surface interpolation. The Natural Neighbor interpolation method from Spatial Analyst tools was chosen for the Mississippi River alluvium mapping because this algorithm best honored the assigned numerical values for lithologic classification. The interpolation assigned raster values to the pixels between well locations based upon the weight and distance between data points. This process created a raster of values with decimal ranges between the initially assigned values. All pixel values were multiplied by 100 to make whole number Raster values, which were then converted to integer values. The polygonal surfaces were then imported into ArcScene 10.3.1 and were stacked by their layer depth in 5 ft sheets from the ground surface to 300 feet depth. Layers can be deactivated and reactivated so that each 5 ft (1.5 m) layer within the Mississippi River alluvium of Lake County can be examined (see Weathers, 2019), and a three-dimensional model is presented here.
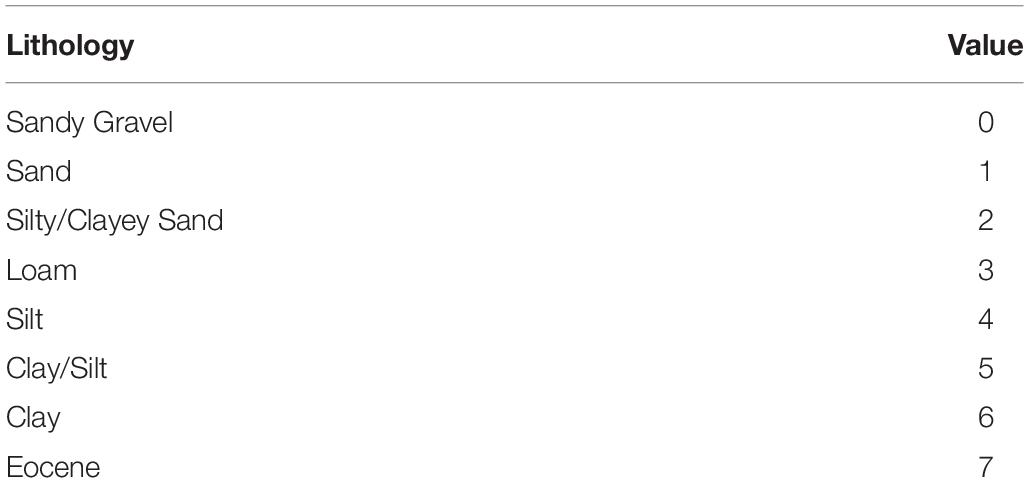
Table 2. Values assigned to lithologies for the 3-D Quaternary model.
Lake County 3-D Geologic Model From Ground Surface to the Top of the Paleozoic
A second 3-D Geologic Model was made that includes the Quaternary Mississippi River alluvium to the top of the Paleozoic. Faulted structure contour maps of the tops of the Eocene, Late Cretaceous, and Paleozoic sections were imported into ArcScene 10.3.1. These surface rasters were vertically stacked to the elevations of each geologic unit’s surface raster. The Spline with Barriers method was then used to pass the fault planes through the model.
Results
Structure Contour Maps
Principal objectives of this research were to make three-dimensional models of the geology beneath Lake County, Tennessee, to better understand the stratigraphy and structure underlying the county. This information is critical to assessing the seismic hazards of Lake County (Cramer et al., 2004, 2018a). Faulted and unfaulted structure contour maps were made of the tops of the Eocene (Figure 5), Cretaceous (Figure 6), and Paleozoic (Figure 7). Faults shown in Figure 3 were used for the faulted structure contour maps.
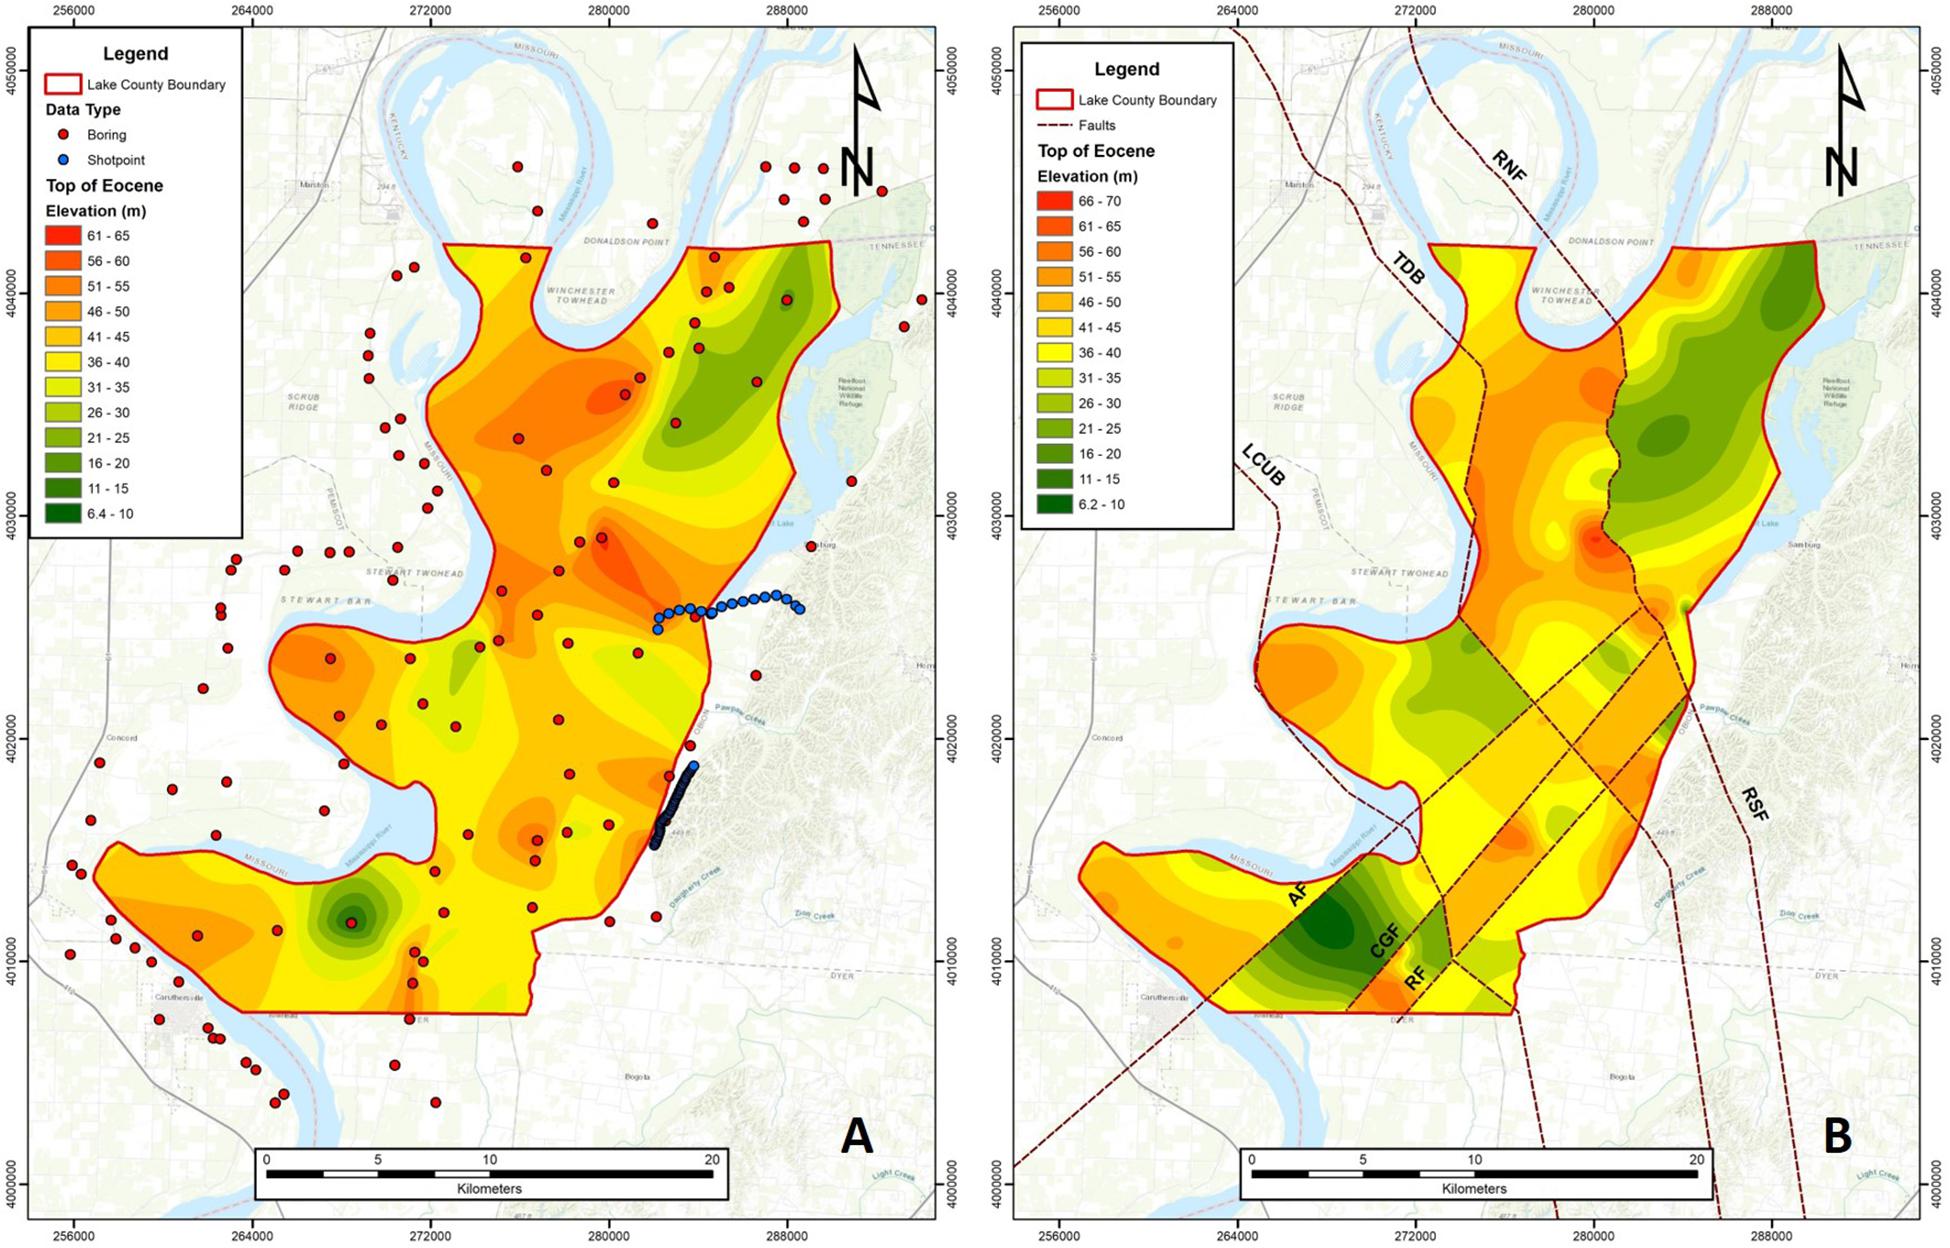
Figure 5. (A) Structure contour map of the top of the Eocene strata. (B) Faulted structure contour map of the top of the Eocene strata. AF, Axial; CGF, Cottonwood Grove; RF, Ridgely; RNF, Reelfoot North; RSF, Reelfoot South; TDB, Tiptonville dome back thrust; LCUB, Lake County uplift back thrust faults. Contour interval is 5 m.
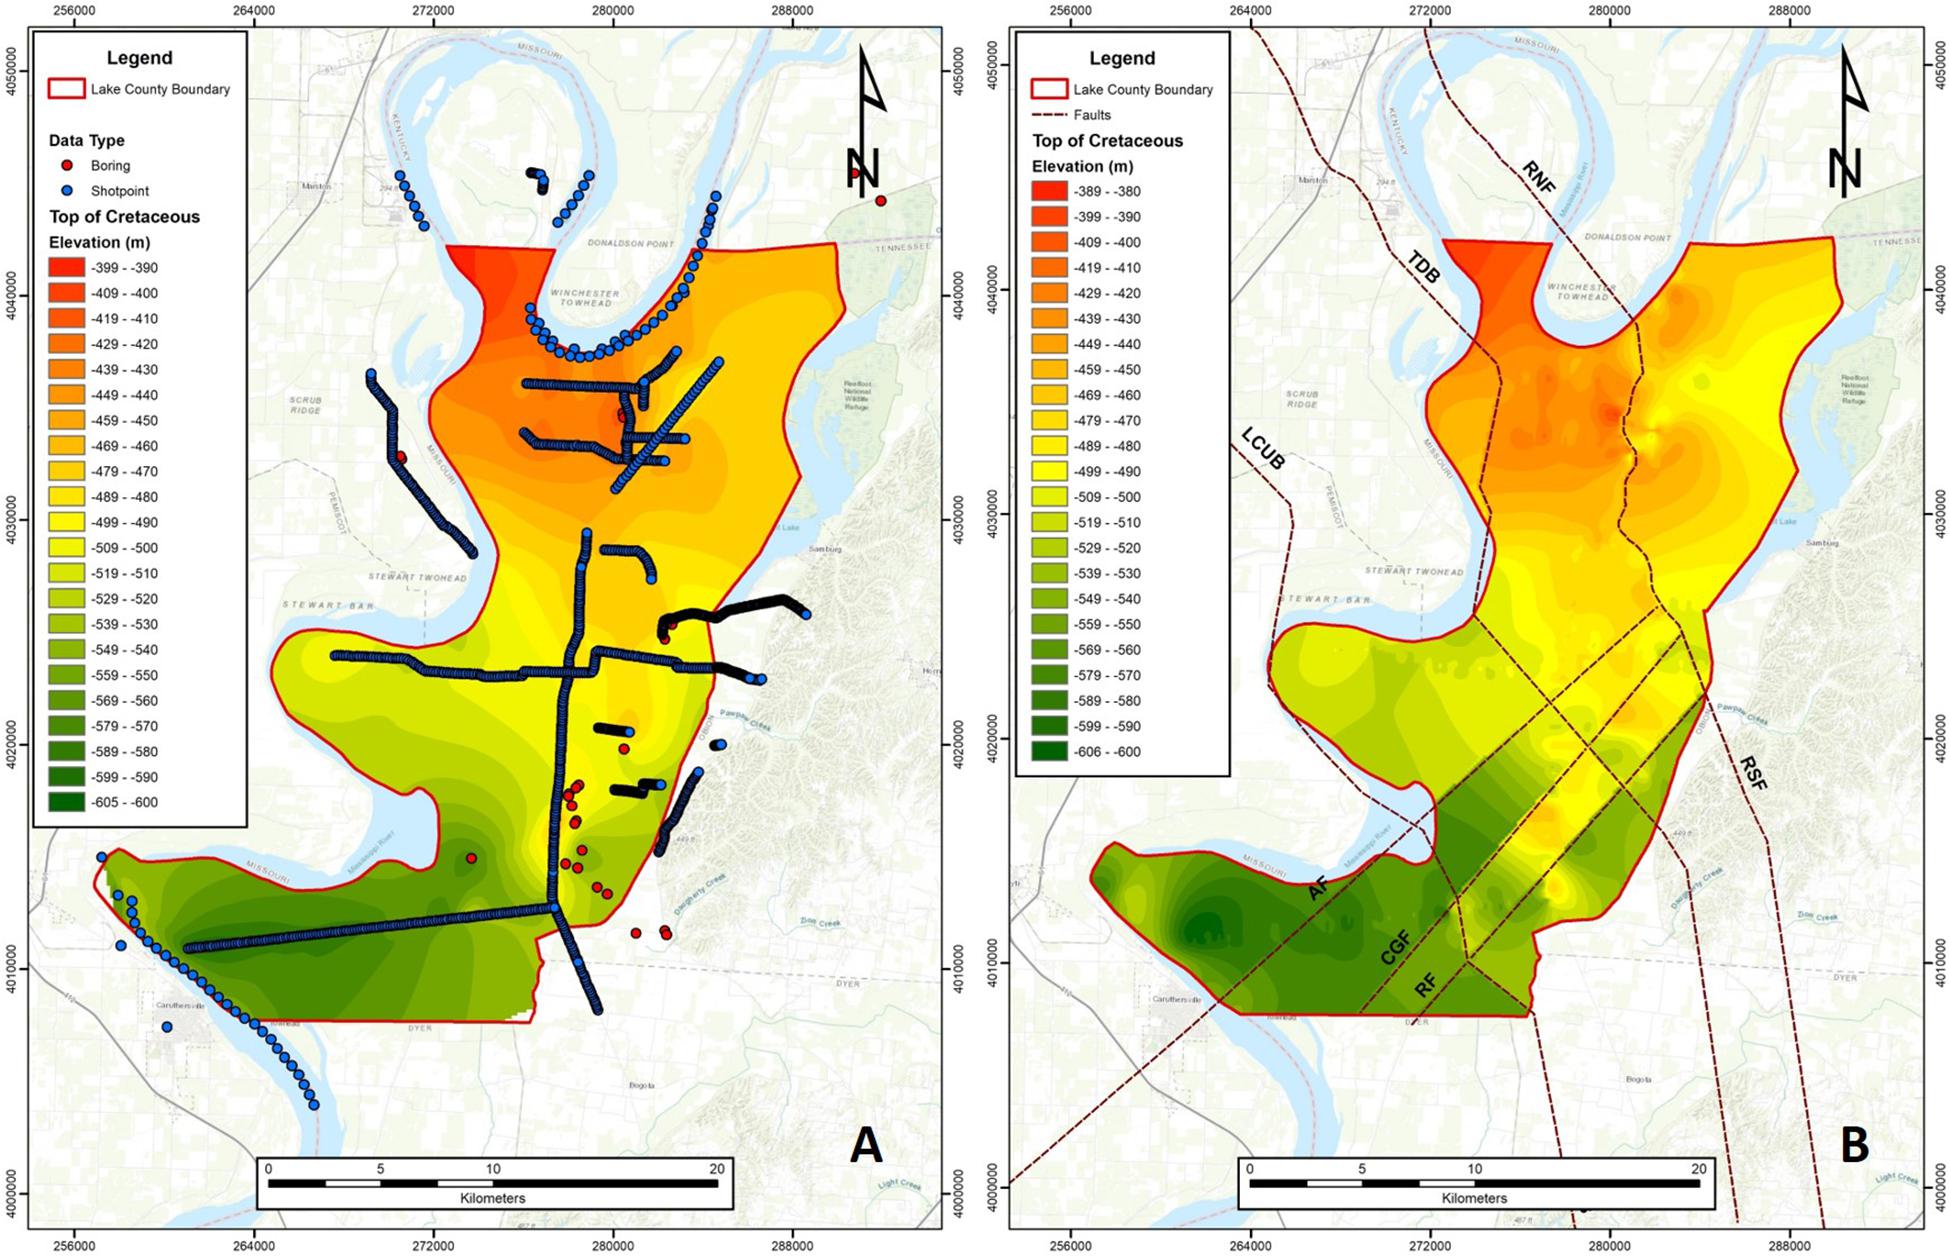
Figure 6. (A) Structure contour map of the top of the Cretaceous strata. (B) Faulted structure contour map of the top of the Cretaceous strata. AF, Axial; CGF, Cottonwood Grove; RF, Ridgely; RNF, Reelfoot North; RSF, Reelfoot South; TDB, Tiptonville dome back thrust; LCUB, Lake County uplift back thrust faults. Contour interval is 10 m.
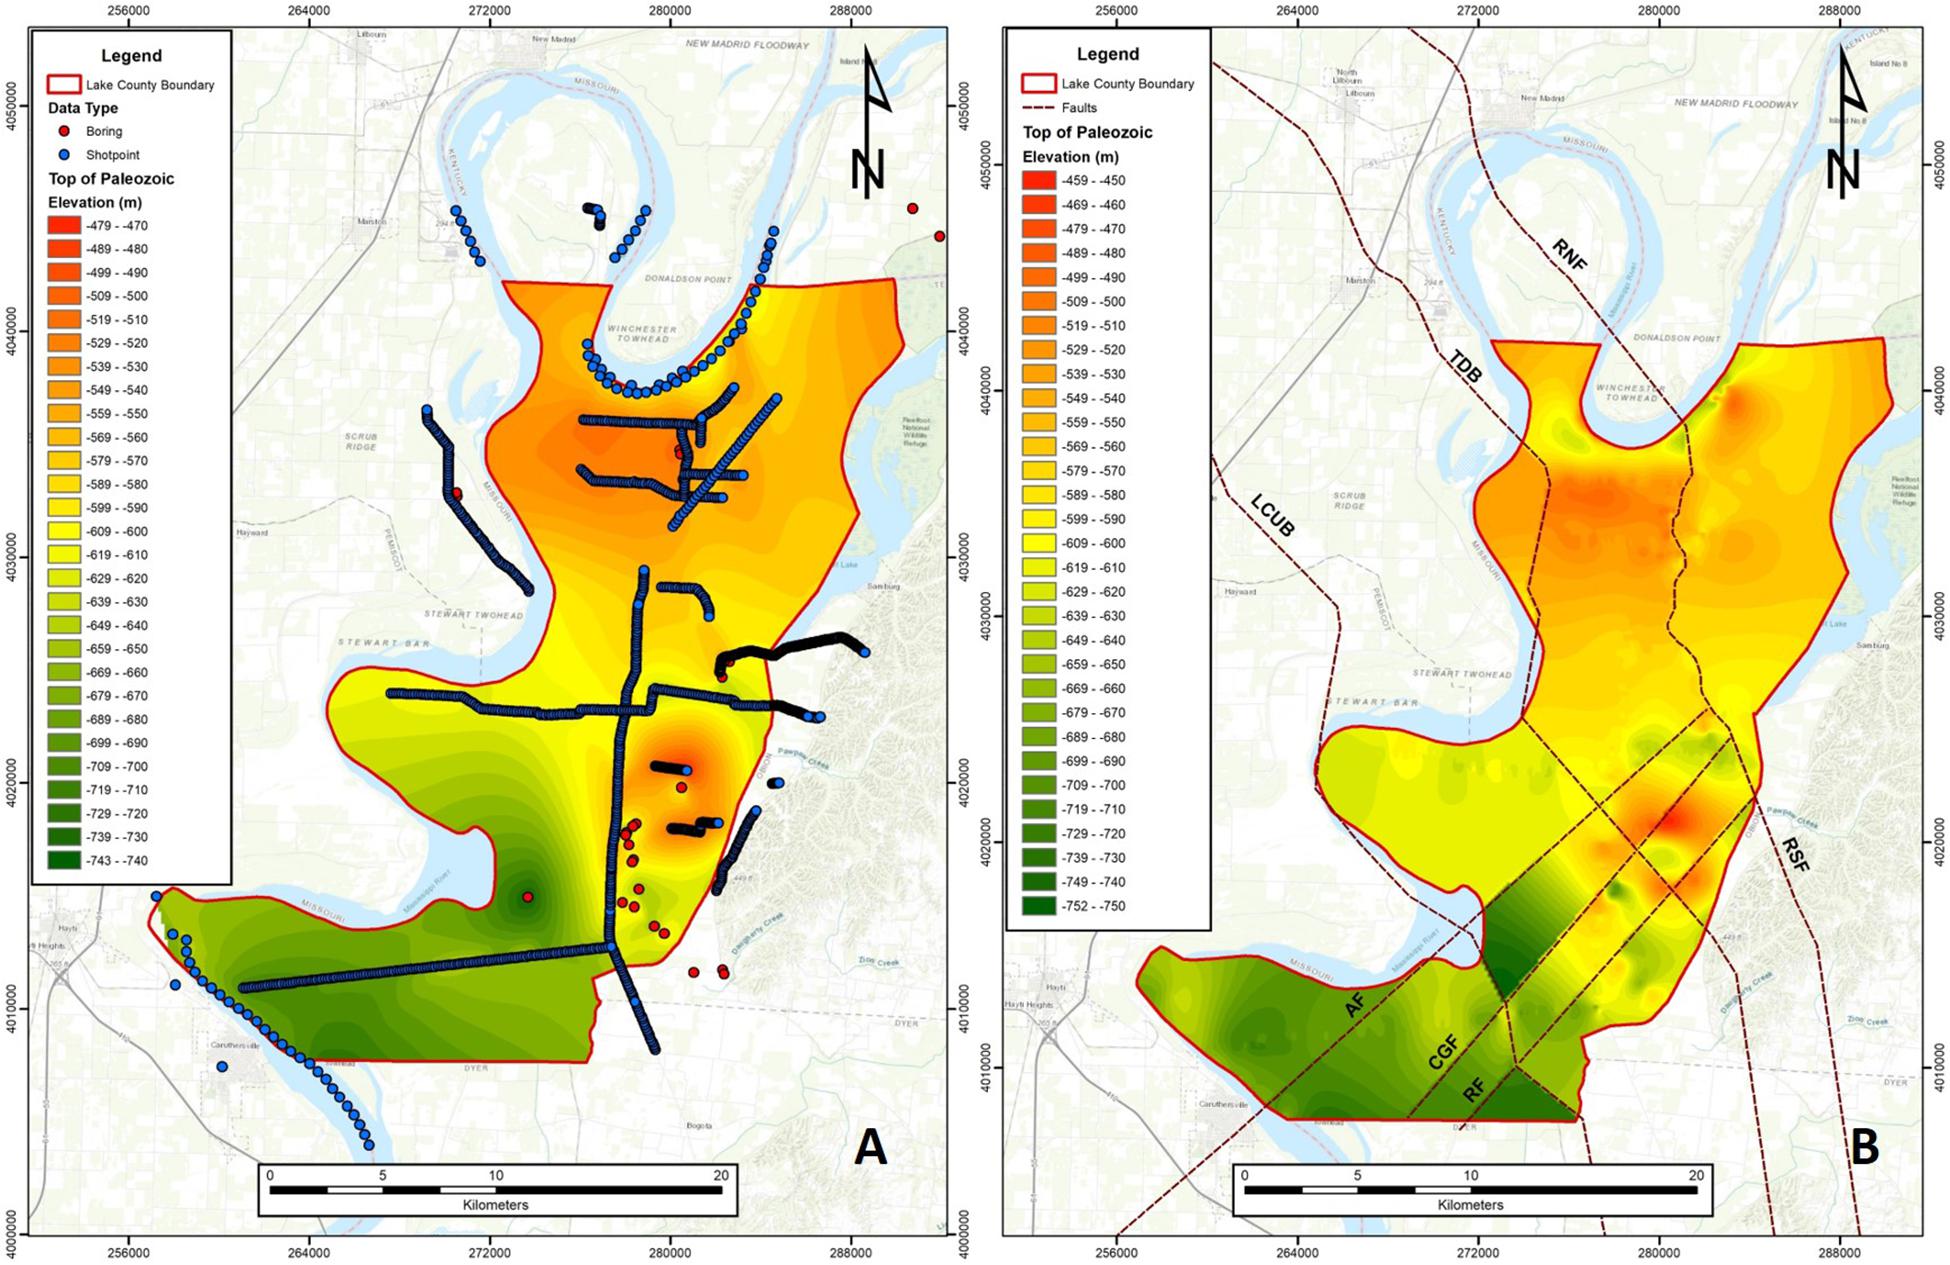
Figure 7. (A) Structure contour map of the top of the Paleozoic strata. (B) Faulted structure contour map of the top of the Paleozoic strata. AF, Axial; CGF, Cottonwood Grove; RF, Ridgely; RNF, Reelfoot North; RSF, Reelfoot South; TDB, Tiptonville dome back thrust; LCUB, Lake County uplift back thrust faults. Contour interval is 10 m.
The top of the Eocene is high on the Tiptonville dome and Ridgely ridge and low in the southwestern corner of the county and beneath Reelfoot Lake (Figure 5). The top of the Cretaceous deepens under Lake County from north to south (Figure 6). It is also high on both the Tiptonville dome and Ridgely ridge and low beneath Reelfoot Lake basin. The top of the Paleozoic has the same highs and lows as the Cretaceous, but the top of the Paleozoic is highest beneath Ridgely ridge (Figure 7).
Cross-Sections
Six cross-sections were made across Lake County (Figure 3). Two cross-sections were made for each cross-section line; one unfaulted and one faulted. Cross-Section A-A’ (Figure 8) crosses faults TDB, RNF, and NMF. Fault TDB is not evident in Figure 8A, but once the fault is introduced in Figure 8B the Tiptonville dome (TD) becomes readily identifiable. The Reelfoot North fault is evident and displaces each unit from the Paleozoic into the base of the Quaternary. Reelfoot Lake is underlain by a graben bounded by the Reelfoot North fault and the NMF.
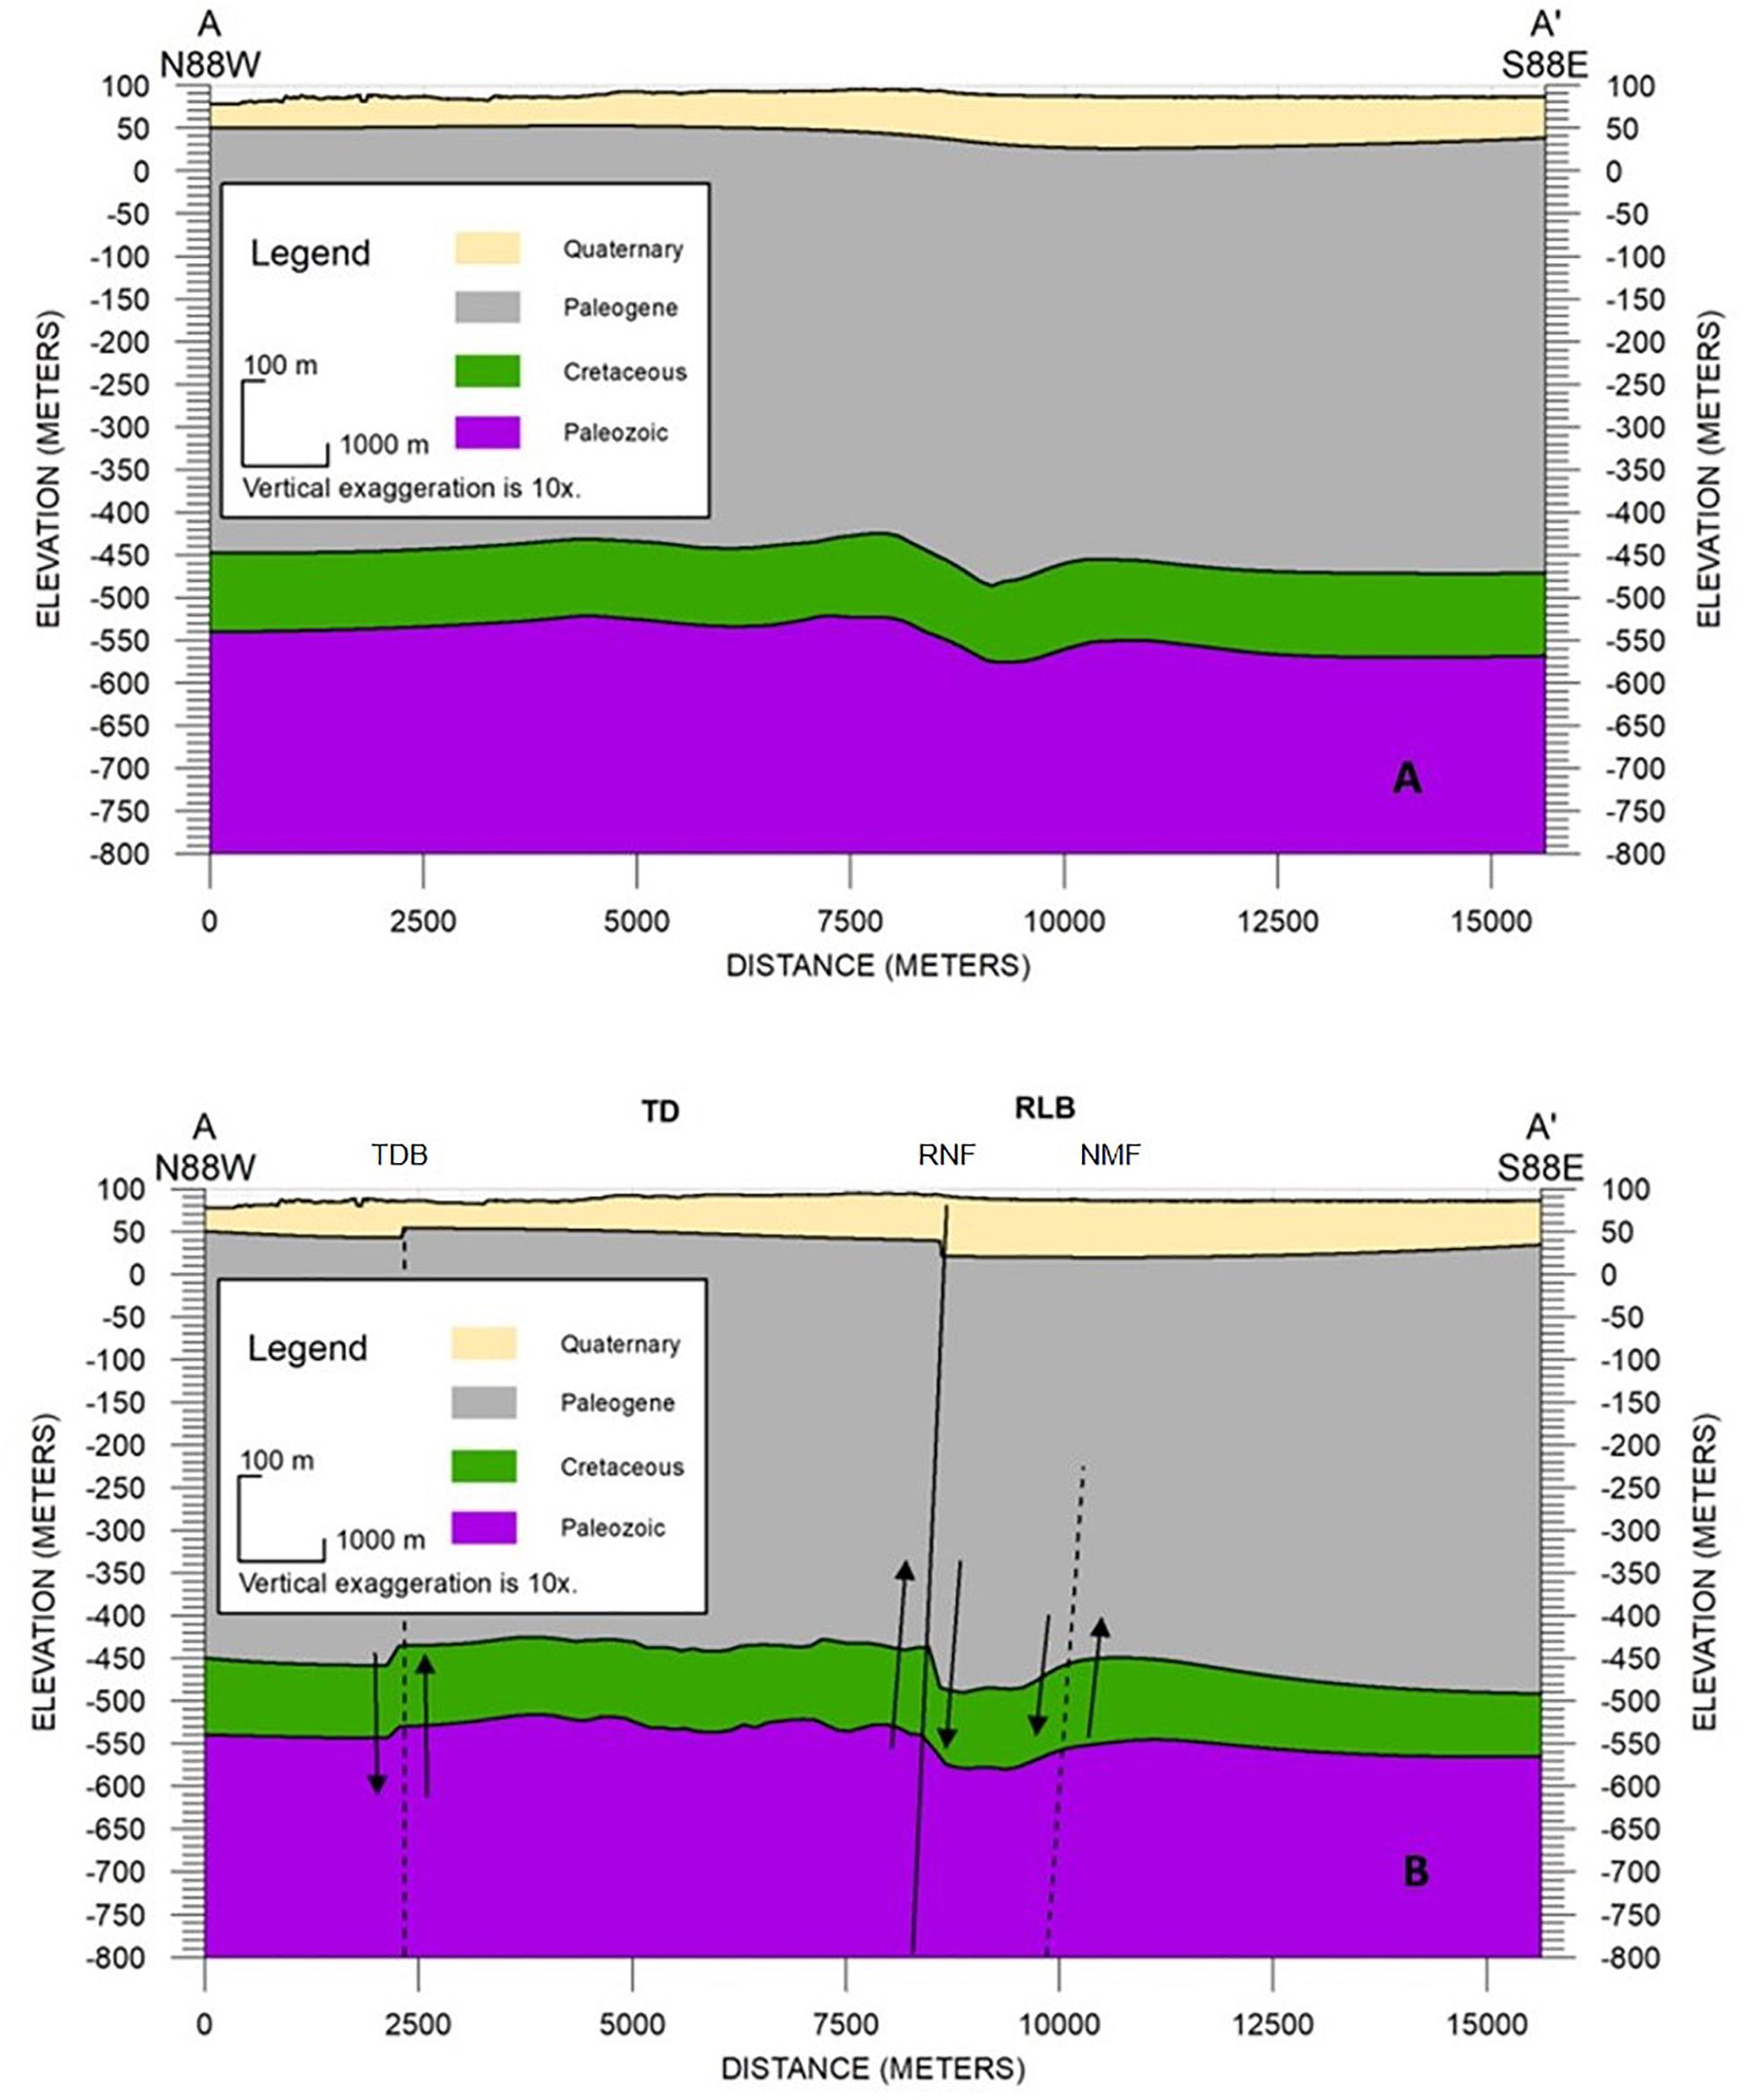
Figure 8. (A) Cross-Section A-A’ (unfaulted) as located in Figure 3 shows the Quaternary alluvium (peach), Eocene (gray), Cretaceous (green), and Paleozoic (purple). (B) Faulted Cross-Section A-A’. TD, Tiptonville dome; RLB, Reelfoot Lake basin; TDB, Tiptonville dome back thrust fault; RNF, Reelfoot North fault; NMF, New Markham fault. Vertical exaggeration = 10.
Cross-Section B-B’ (Figure 9) crosses faults AF, CGF, and RF. The AF is not apparent in Figure 9A though the Cretaceous thickens at this location but is evident in Figure 9B with up-to-the-west displacement on the tops of the Paleozoic and the Cretaceous. The Cottonwood Grove and Ridgely faults are evident as the west-bounding and east-bounding faults, respectively, of the Ridgely ridge horst at depth. The CGF has up-to-the-east displacement on the tops of the Paleozoic and the Cretaceous but does not appear to show displacement on the top of the Eocene. Both the Axial and Ridgely faults show an apparent reverse sense of displacement on the top of the Eocene as compared to the deep section. There are also two grabens adjacent to Ridgely ridge.
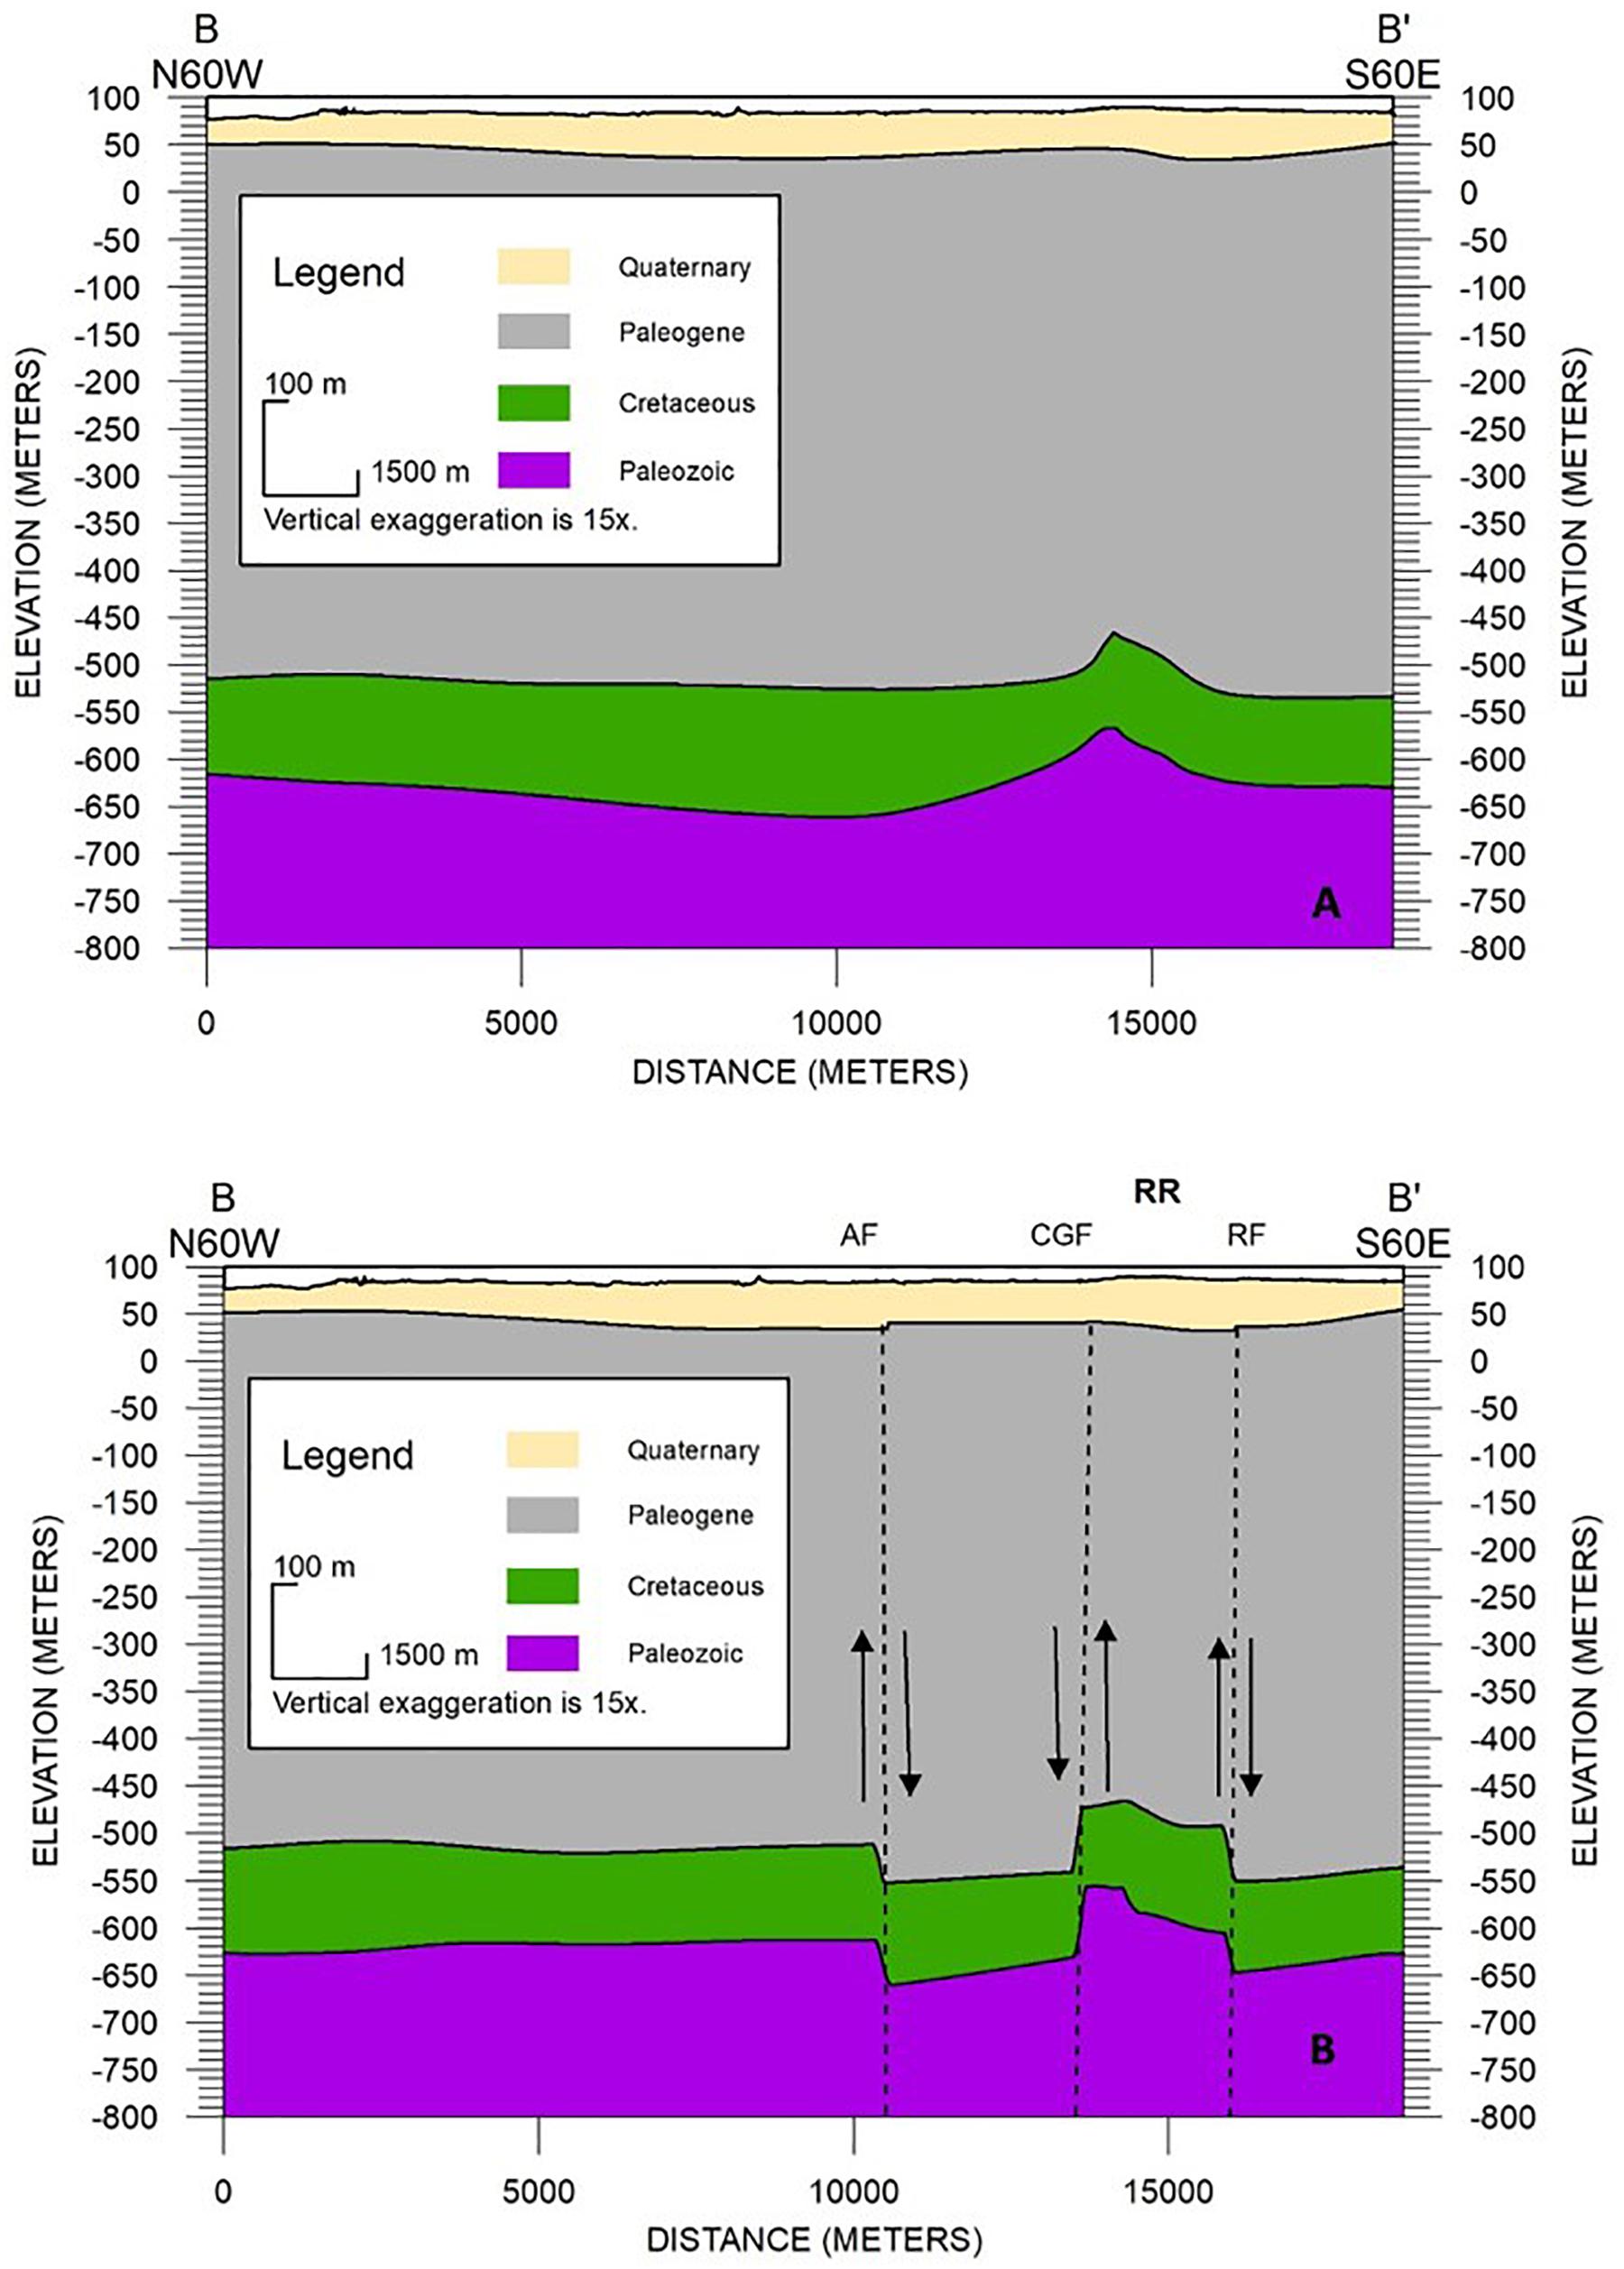
Figure 9. (A) Cross-Section B-B’ (unfaulted) as located in Figure 3 shows the Quaternary alluvium (peach), Eocene (gray), Cretaceous (green), and Paleozoic (purple). (B) Faulted Cross-Section B-B”. RR, Ridgely ridge; AF, Axial fault; CGF, Cottonwood Grove fault; RF, Ridgely fault. Vertical exaggeration = 15.
Cross-Section C-C’ (Figure 10) crosses the AF, CGF, LCUB, and RF. Ridgely ridge and its bounding faults are evident in these cross-sections. The AF shows down-to-the-east displacement on each contact. The CGF has down-to-the-east displacement, the LCUB has up-to-the-east displacement, and the RF has up-to-the-west displacement. There also appear to be previously unidentified faults west and east of Ridgely ridge that displace the tops of the Paleozoic and the Cretaceous, but not the top of the Eocene.
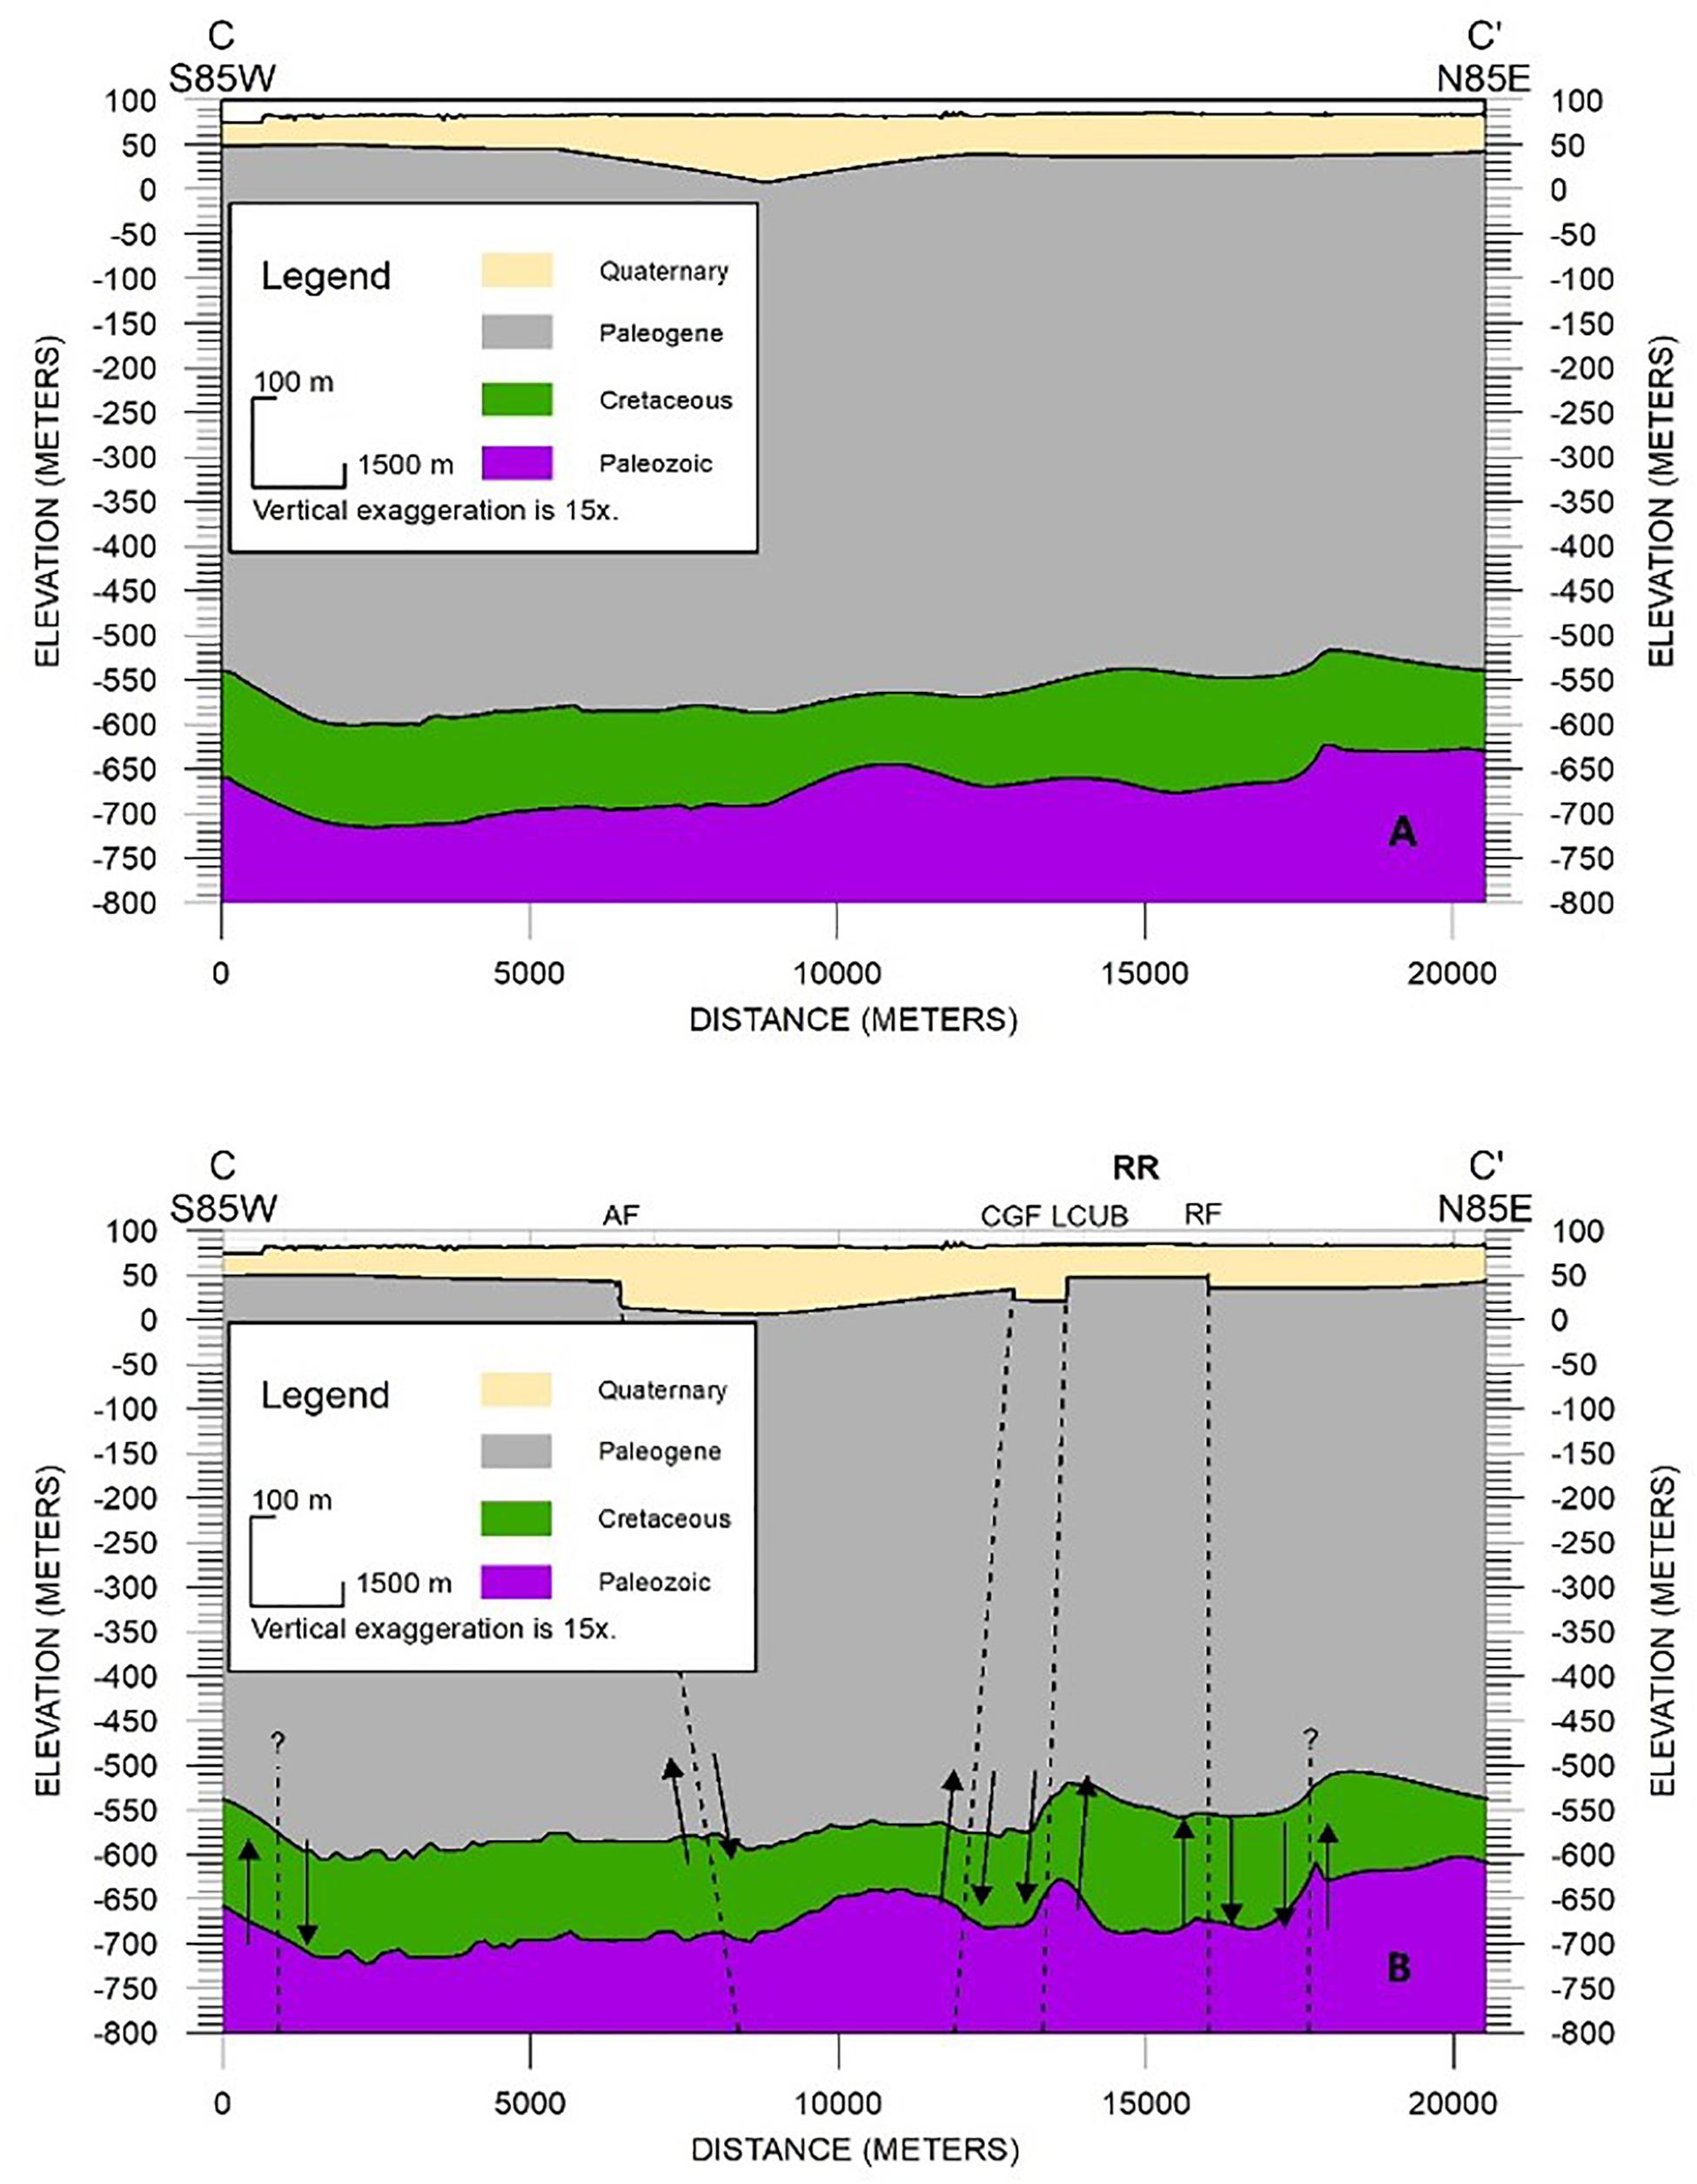
Figure 10. (A) Cross-Section C-C’ (unfaulted) as located in Figure 3 shows the Quaternary alluvium (peach), Eocene (gray), Cretaceous (green), and Paleozoic (purple). (B) Faulted Cross-Section C-C’. RR, Ridgely ridge; AF, Axial fault; CGF, Cottonwood Grove fault; LCUB, Lake County uplift back thrust fault; RF, Ridgely fault. Vertical exaggeration = 15.
3-D Mississippi River Quaternary Alluvium Geologic Model of Lake County
A 3-D geologic model of the Mississippi River Quaternary alluvium in Lake County was made using 336 borings (Figures 11, 12). The model illustrates the predominantly clay and silt (green and blue) flood plain sediment within the upper 25 ft (7.6 m). The clay and silt deposits are thicker on the eastern side of the county where small streams draining the bluffs have deposited alluvial fan sediment. The red, orange, and yellow colors are the point bar sands and sandy gravel channel deposits. Surface sand deposits are earthquake liquefaction deposits (sand blows) and modern alluvium along the Mississippi River (Figure 11). The Mississippi River point bar sequence sands and underlying channel sandy gravels are located from 25 ft (7.6 m) to a maximum depth of about 250 ft (76.2 m) (Figure 12). Below the alluvium are Eocene sediments. The individual 5-ft (1.5 m) alluvial layers are in Weathers (2019) and a video animation of the 3-D model is in Supplementary Appendix A. Although the Mississippi River is approximately 100 ft (30.5 m) deep along the western margin of Lake County, a river depth of 5 ft (1.5 m) is used in the Supplementary Appendix A model so that the alluvial stratigraphy can be seen along the western side of the model. Reelfoot Lake is assumed to be approximately 5 ft (1.5 m) deep over most of the lake, and so the lake water is only shown at the surface and the first 5 ft (1.5 m) depth interval (Figure 12).
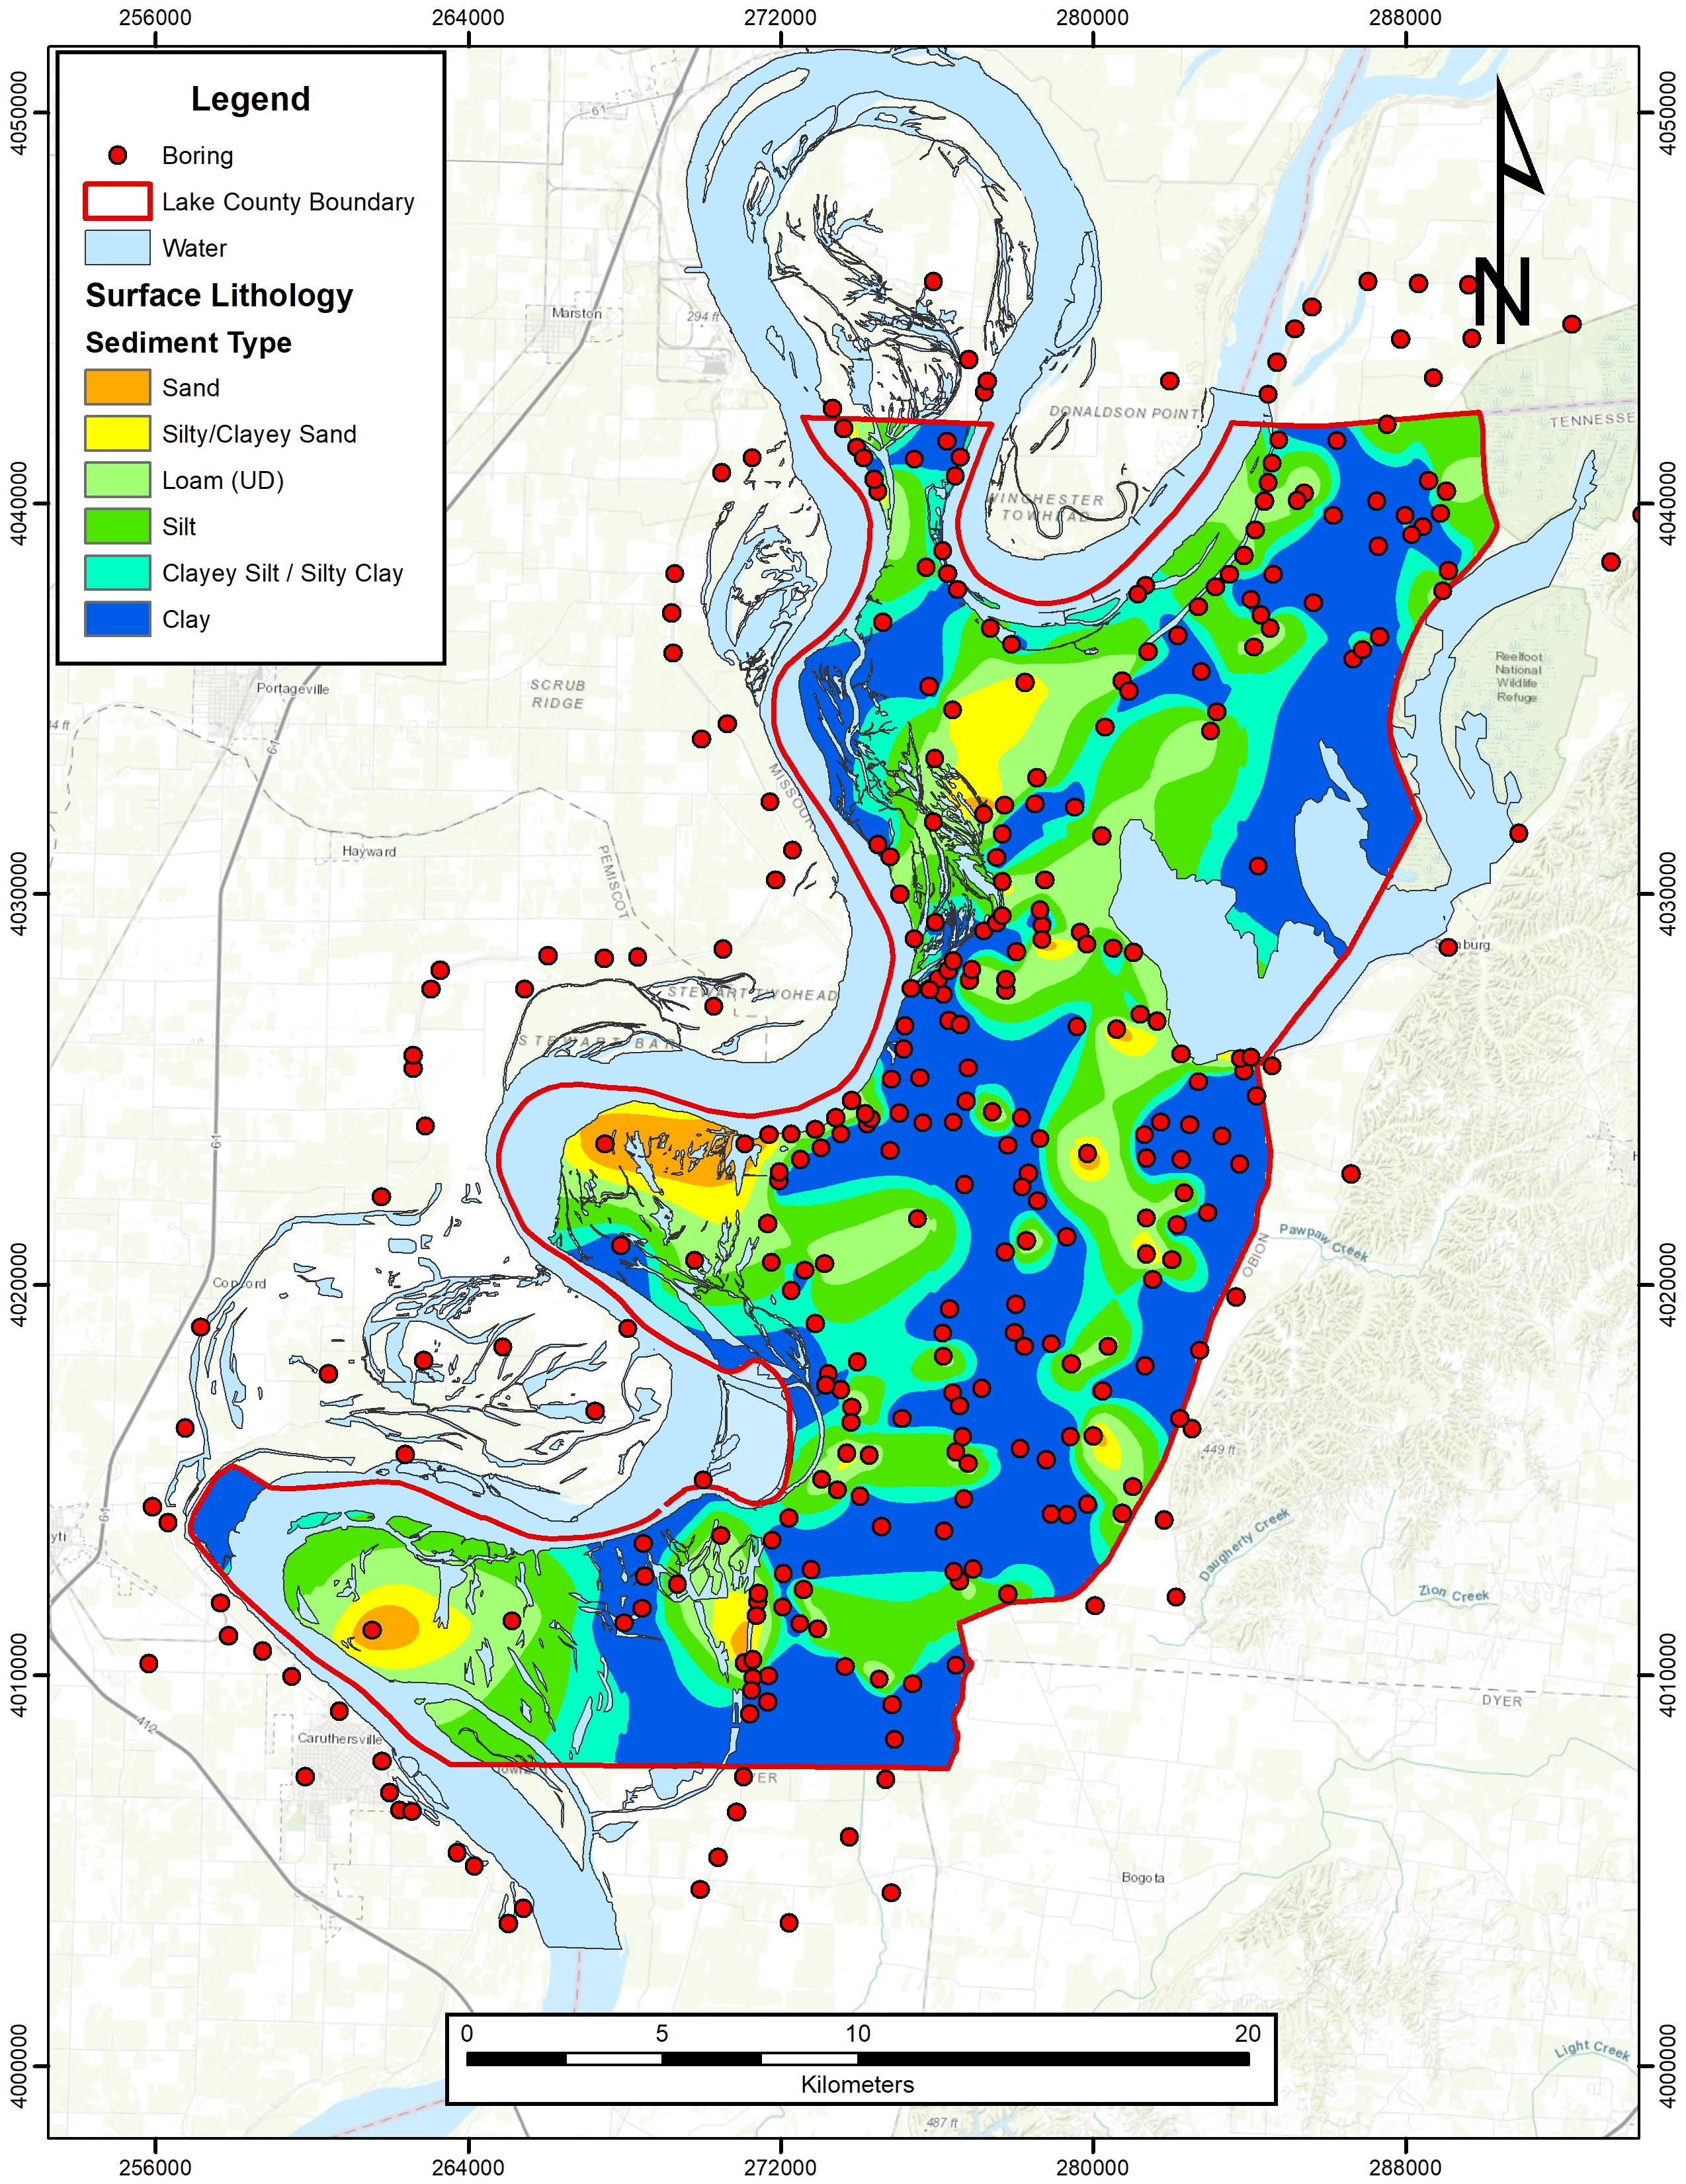
Figure 11. Surface geology of Lake County, Tennessee and surface layer (0 ft) of the 3-D Quaternary Model in Figure 12. Individual alluvial 5 ft (1.3 m) layers are in Weathers (2019).
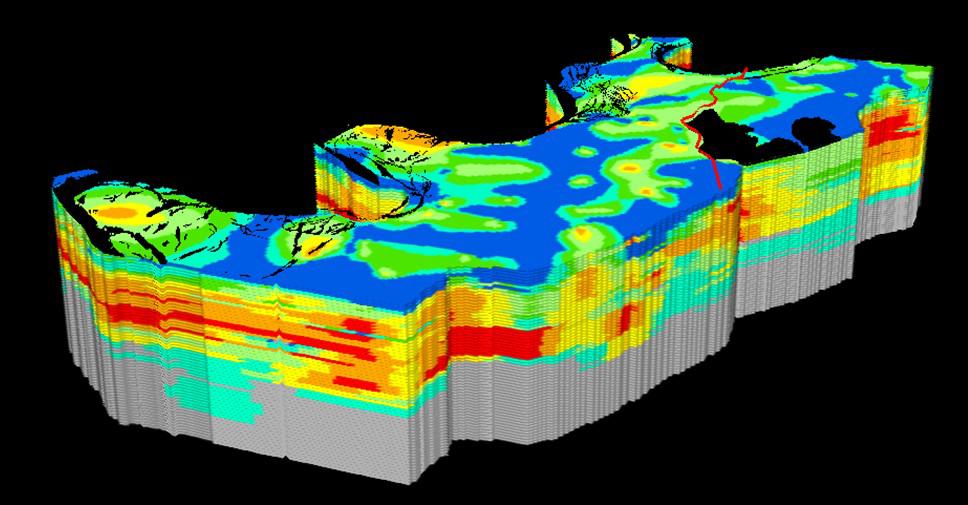
Figure 12. 3-D Geologic Model showcasing distribution of Quaternary alluvium under Lake County, Tennessee. Red is sandy gravel, orange is sand, yellow is silty sand or clayey sand, light green is an unknown mix with percentages of clay, silt, and sand, green is silt, light blue is clayey silt or silty clay, and blue is clay. Gray represents Eocene. Reelfoot Lake and the Mississippi River are black. Red line illustrates the location of the surficial Reelfoot scarp. Vertical exaggeration = 25. Animation in Supplementary Appendix A.
3-D Geologic Model of Lake County From the Surface to the Top of the Paleozoic
A 3-D geologic model from the land surface to the top of the Paleozoic of Lake County is illustrated in Figure 13 and as a rotating 3-D model in Supplementary Appendix B. In the model, the top of the Quaternary alluvium Lidar DEM overlies the Eocene (gray), Cretaceous (green), and Paleozoic (purple) of Lake County. The faulted structure contour surfaces are stacked in ArcScene relative to mean sea level and the faults are extruded as vertical planes through the model. The only fault that is displayed as deforming the ground surface is the Reelfoot fault along the Reelfoot scarp monocline.
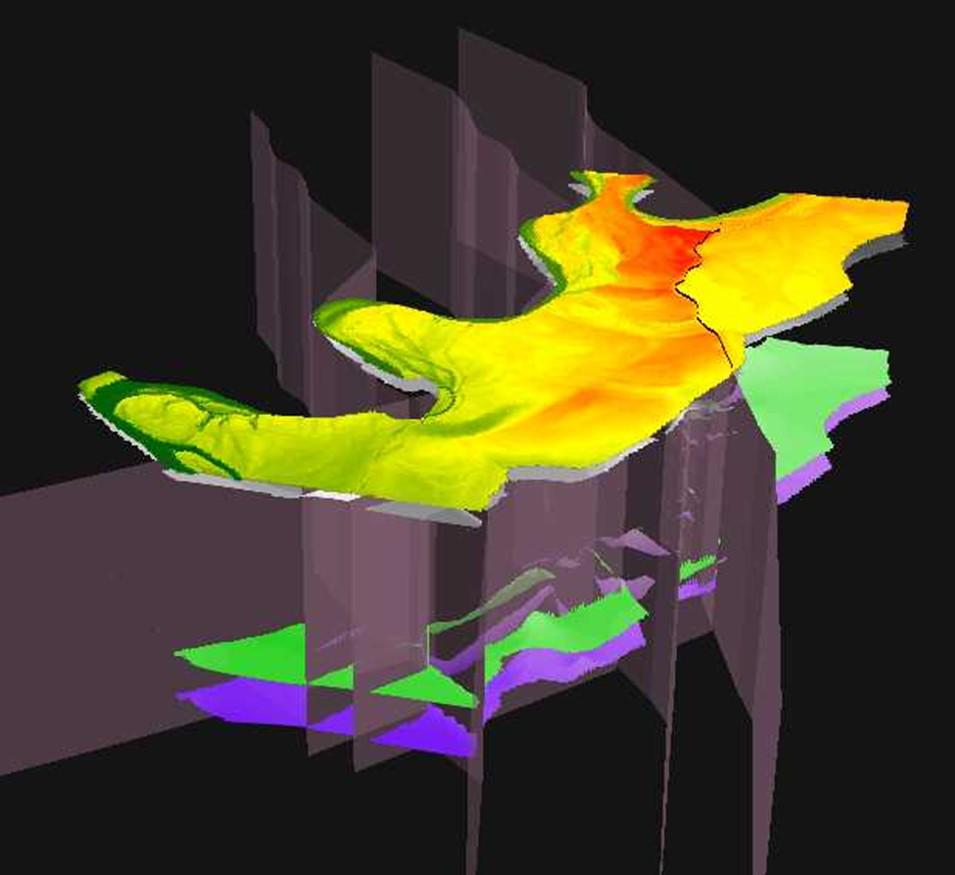
Figure 13. 3-D Landscape Surface to Paleozoic Model of Lake County, Tennessee. Landscape surface (yellow), tops of Eocene (gray), Cretaceous (green), and Paleozoic (purple) shown as stacked layers based on elevation (m). Faults shown as vertical planes slicing through the geologic surfaces. Vertical exaggeration = 15. Animation in Supplementary Appendix B.
Discussion
Structure Contour Maps
The top of the Eocene structure contour map (Figure 5) reveals a structural high on the Tiptonville dome and to a lesser extent, Ridgely ridge. The Reelfoot Lake basin has limited information, but the top of the Eocene appears to be structurally low. The top of the Eocene also has a southerly trend of lows on the western side of Lake County.
The tops of the Cretaceous (Figure 6) and the Paleozoic (Figure 7) have similar structural relief. Both contoured surfaces have highs in the northern portion of the county and highs on the Tiptonville dome and Ridgely ridge with lows in the southwestern part of the county. However, the Paleozoic is at least ∼ 40 m (131 ft) higher on Ridgely ridge than it is on the Tiptonville dome.
Geologic Cross-Sections
Unfaulted and faulted geologic cross-sections were generated across Lake County (Figure 3). Cross-Section A-A’ (Figure 8) illustrates a W-E profile across northern Lake County. The Paleogene is ∼ 1,640 ft (500 m) thick and the Cretaceous is ∼ 328 ft (100 m) thick along A-A’. Quaternary alluvium thickness is 82 to 197 ft (25 to 60 m) along A-A,’ thus revealing ∼1,970 ft (600 m) of unconsolidated sediment overlying the Paleozoic carbonates. Cross-Section A-A’ crosses the Tiptonville dome back thrust, Reelfoot North, and NMFs. The Reelfoot North fault displaces the top of the Paleozoic through the top of the Eocene and illustrates fault displacement is greater in the deep subsurface (Figure 8). The down-to-the-west NMF is present but only displaces the tops of the Paleozoic and Cretaceous. TDB in Cross-Section A-A’ has down-to-the-west displacement through the section.
Cross-Section B-B’ (Figures 3, 9) is a NW-SE oriented section through the center of Lake County and crosses the Axial, Cottonwood Grove, and Ridgely faults. Ridgely ridge appears to be a tilted, asymmetric horst on all mapped stratigraphic tops. The apparent down-to-the-west displacement on the top of the Eocene across the RF and absence of displacement on the top of the Eocene across the CGF are interpreted to be an artifact due to insufficient well data along this portion of the line of section because Ridgely ridge was uplifted during the Quaternary resulting in its relief evident in Figure 3 (Stephenson et al., 1995). The apparent down-to-the-west displacement on the top of the Eocene across the AF is interpreted to be due to Mississippi River erosion.
Cross-Section C-C’ (Figures 3, 10) is a W-E section that crosses the southern portion of Lake County. The Quaternary is on average 50 m (164 ft) thick and it is nearly 70 m (230 ft) thick in the center of the cross-section where there is a trough. Cross-Section C-C’ shows that the AF, CGF, LCUB, and RF faults displace the top of the Paleozoic through the top of the Eocene. The CGF is the down-to-the-west, west-bounding fault of Ridgely ridge in Cross-Section B-B’ but in Cross-Section C-C’ the CGF is down-to-the-east. We do not know the reason for this apparent slip reversal but note that the surface expression of Ridgely ridge in Figure 3 indicates that the Ridgely ridge horst may terminate near Cross-Section C-C’. There are previously unidentified faults near the eastern and western ends of Cross-Section C-C’ that displace the Cretaceous and the Paleozoic but do not displace the top of the Eocene (Figure 10). The interpreted fault at the eastern end of Cross-Section C-C’ is probably a fault postulated by Liu (1997) and Greenwood et al. (2016).
The geologic cross-sections (Figures 8–10) and the Lake County fault map (Figure 3) are of particular value to the residents of Lake County. These figures illustrate where faulting may produce surface rupture and what sense of displacement is expected if a large earthquake were to occur within the county.
Lake County 3-D Mississippi River Quaternary Alluvium Geologic Model
Figure 11 illustrates the surface alluvial geology of Lake County and Figure 12 illustrates the surface and subsurface Quaternary alluvium from the surface of Lake County to 300 ft (91.4 m) depth. Figure 12 is presented as a rotating 3-D model in Supplementary Appendix A. The sediments from the ground surface to a depth of ∼ 30 ft (9.1 m) are predominantly fine-grained silts and clays. From 30 to 155 ft (9.1 to 47.2 m), the dominant sedimentary units are clayey or silty sand, sand, and sandy gravel. The greatest concentration of sandy gravel is from depths 60 to 120 ft (18.3 to 36.6 m). Below 155 ft (47.2 m), the dominant lithology is Eocene strata. Subsurface paleochannels are evident in the 3-D Quaternary alluvium model as zones of high sand and gravel concentration (Figure 12 and Supplementary Appendix A). Near-surface sediment type, thickness, age, and ground water level are all critical to assessing the earthquake liquefaction potential of a site (Cramer et al., 2014, 2018a,b). The distributions and thicknesses of sand, silt, and clay in the uppermost 100 ft (30.5 m) of our Quaternary alluvium model provide important information for assessing the liquefaction potential for Lake County (Cramer et al., 2018a,b).
Although not a focus of this study, we believe that our Quaternary Mississippi River alluvium maps and 3-D alluvium model provide valuable subsurface information for Lake County farmers. Lake County irrigation wells pump water from shallow wells drilled into sand and gravel horizons in the Mississippi River flood plain alluvium. Our 5 ft (1.5 m) alluvial layers (Weathers, 2019) and the 3-D Quaternary alluvium model (Supplementary Appendix A) illustrate the depth and thickness of sands and sandy gravels that would be excellent targets for shallow agricultural water wells.
Lake County 3-D Geologic Model From Ground Surface to the Top of the Paleozoic
The three-dimensional Lake County geologic model in Figure 13 and Supplementary Appendix B shows a generalized interpretation of the subsurface geology using a ground surface Lidar DEM and the faulted structure contour maps of the tops of the Eocene, Cretaceous, and Paleozoic. The model animation reveals the subsurface is more complex than the low relief landscape of Lake County would imply. The LCU, Tiptonville dome, Ridgely ridge, and structural lows in southwestern Lake County are well expressed.
The subsurface maps provide essential information in the ongoing assessment of earthquake shaking in the event of a future large local earthquake. Specifically, the different mapped geologic units have their own seismic velocities that contribute to the estimated surface ground motion. In addition, fault displacement influences where these geologic units exist in the subsurface and earthquake ground motion could differ across a fault with large displacement.
Conclusion
Hidden beneath the nearly featureless Mississippi River flood plain of Lake County, Tennessee, lies a rather complex and seismically threatening geology. Tops of the Paleozoic and Cretaceous are displaced across the Reelfoot North, Reelfoot South, New Markham, Tiptonville dome back thrust, LCU back thrust, Axial, Cottonwood Grove, and Ridgely faults (Figures 8–10). In addition, there are two previously unidentified faults in southern Lake County that displace the tops of the Paleozoic and Cretaceous (Figure 10).
The top of the Eocene strata and base of the Quaternary alluvium are displaced across the Reelfoot North, Cottonwood Grove, Ridgely, Axial, Tiptonville dome back thrust, and LCU back thrust faults (Figures 8–10). Thus, it appears that Quaternary uplift has occurred on the LCU, Tiptonville dome, and Ridgely ridge as is evident in their surface topographic relief (Figure 3).
The 3-D Lake County Geologic Model graphically illustrates the subsurface structure to the top of the Paleozoic. This model and Figure 3 illustrate where and what sense of displacement has occurred across the Lake County faults. Perhaps more meaningful to the residents of Lake County is that Figures 3, 8, 9, 10 illustrate where and what sense of movement may occur during a future major earthquake. Further, it is recommended that shallow seismic reflection profiles be acquired across these faults to better document their Quaternary displacements.
The 5 ft (1.5 m) Quaternary Mississippi River alluvium maps (Weathers, 2019) and the 3-D Quaternary Mississippi River alluvium model constructed from the 5 ft layers (Supplementary Appendix A) provide detailed lithologic information to a depth of 300 ft (91.4 m). Earthquake liquefaction readily occurs in young, saturated, sands, at shallow depths. These are precisely the ground conditions in Lake County. An influential factor is the depth of burial by sediments that do not liquefy, like clay. Thus, our maps of the distribution of the near-surface Mississippi River sand and its burial depth by Mississippi River overbank silts and clays contribute to the ongoing liquefaction potential assessment and the maps also illustrate subsurface sand and gravel where potentially high-yield agricultural wells could be drilled.
Data Availability Statement
The datasets generated for this study will not be made publicly available. The datasets are geologic interpretations made by the corresponding author and coauthor. The actual data are in the form of boring well logs or geophysical survey lines. All data besides the lignite logs are non-proprietary and are housed within the respective organizations. The lignite logs are housed at the University of Memphis. RV has access to those logs and can be contacted if a reader wishes to review the boring logs. In respect, I do not believe that a spreadsheet containing our personal geologic elevation picks is meant to be made public unless absolutely necessary because it does not provide new substance. The manuscript provides necessary information and contacts for locating the non-proprietary data. I can mention however that the aforementioned spreadsheet is available as part of a thesis submission from the corresponding author at the University of Memphis and the committee chair is RV.
Author Contributions
TW conducted all GIS-related work including mapping and interpretation. RV provided the lignite boring logs and other data sources. Both authors wrote the manuscript.
Funding
This research was funded in part by a Housing and Urban Development (HUD) research grant (HUD Grant No. B-13-DS-47-0002) which combined the resources of the University of Memphis’, Department of Earth Sciences (ESCI) and Civil Engineering (CIVL) along with the Center for Earthquake Research and Information (CERI) with other outside entities working in tandem as part of a five-year multidisciplinary project, and entitled the University of Memphis Hazard Mapping, Assessment and Education (HazMAE) project, which will provide multi-hazard data to communities for hazard mitigation and resilience efforts.
Conflict of Interest
TW conducted and completed all work related to the project during the course of the author’s graduate program at the University of Memphis and was subsequently employed by ATC Group Services, LLC.
The remaining author declares that the research was conducted in the absence of any commercial or financial relationships that could be construed as a potential conflict of interest.
Acknowledgments
We would like to acknowledge and thank the entities that provided the data and resources necessary for completion of this research project including Dr. Chris Cramer (CERI), Dr. David Arellano (CIVL), Luke Ewing and William Mann of TDEC, the US Army Corps of Engineers, CEASER, and Kevin Smith and Will Cupples of Fugro United States Marine, Inc. We also wish to thank our reviewers for their insightful comments.
Supplementary Material
The Supplementary Material for this article can be found online at: https://www.frontiersin.org/articles/10.3389/feart.2019.00273/full#supplementary-material
References
Autin, W. J., Burns, S. F., Miller, B. J., Saucier, R. T., and Snead, J. I. (1991). “Quaternary geology of the lower mississippi valley,” in Quaternary Nonglacial Geology: Conterminous U.S, ed. R. B. Morrison, (Boulder: GSA), 547–582. doi: 10.1130/dnag-gna-k2.547
Boyd, O. S., Smalley, R. Jr., and Zeng, Y. (2015). Crustal deformation in the New Madrid seismic zone and the role of postseismic processes. J. Geophys. Res. Solid Earth 120, 5782–5803. doi: 10.1002/2015JB012049
Chen, C., Zhao, D., and Wu, S. (2014). Crust and upper mantle structure of the new madrid seismic zone: insight into intraplate earthquakes. Phys. Earth Planet. Inter. 230, 1–14. doi: 10.1016/j.pepi.2014.01.016
Chiu, J. M., Johnston, A. C., and Yang, Y. T. (1992). Imaging the active faults of the central New Madrid seismic zone using PANDA array data. Seismol. Res. Lett. 63, 375–393. doi: 10.1785/gssrl.63.3.375
Cox, R. T., Lumsden, D. N., and Van Arsdale, R. B. (2014). Possible relict meanders of the pliocene mississippi river and their implications. J. Geol. 122, 609–622. doi: 10.1086/676974
Cox, R. T., and Van Arsdale, R. B. (1997). Hotspot origin of the mississippi embayment and its possible impact on contemporary seismicity. Eng. Geol. 46, 201–216. doi: 10.1016/S0013-7952(01)00062-X
Cox, R. T., and Van Arsdale, R. B. (2002). The Mississippi Embayment, North America: a first-order continental structure generated by the cretaceous superplume mantle event. J. Geodyn. 34, 163–176. doi: 10.1016/S0264-3707(02)00019-4
Cramer, C. H., Van Arsdale, R., Arellano, D., Pezeshk, S., Horton, S., Weathers, T., et al. (2018b). “Seismic and liquefaction hazard maps for lake county, northwestern tennessee,” in Proceedings of the Conferenceon the 67th Annual Southeastern GSA Section Meeting - 2018. Boulder: Geological society of America.
Cramer, C. H., Dhar, M. S., and Arellano, D. (2018a). Update of the urban seismic and liquefaction hazard maps for memphis and shelby county, tennessee: liquefaction probability curves and 2015 hazard maps. Seismol. Res. Lett. 89, 688–701. doi: 10.1785/0220170139
Cramer, C. H., and Boyd, O. S. (2014). Why the new madrid earthquakes are m7-8 and the charleston earthquake is ∼M 7. Bull. Seismol. Soc. Am. 104, 2884–2903. doi: 10.1785/0120120257
Cramer, C. H., Gomberg, J. S., Scheig, E. S., Waldron, B. A., and Tucker, K. (2004). Memphis, Shelby County, Tennessee, Seismic Hazard Maps. Report No 04-1294. Reston: U.S. Geological Survey.
Cramer, C. H., Van Arsdale, R. B., Dhar, M. S., Pryne, D., and Paul, J. (2014). Update of urban seismic hazard maps for memphis and shelby county, tennessee: geology and vs observations. Seismol. Res. Lett. 85, 986–996. doi: 10.1785/0220140011
Crone, A. J. (1981). Sample Description and Stratigraphic Correlation of the New Madrid Test Well-1-X. U.S. Report No 81-426. Reston: U.S. Geological Survey.
Csontos, R., and Van Arsdale, R. (2008). New Madrid seismic zone fault geometry. Geosphere 4, 802–813.
Csontos, R., Van Arsdale, R., Cox, R., and Waldron, B. (2008). The reelfoot rift and its impact on quaternary deformation in the central mississippi river valley. Geosphere 4, 145–158. doi: 10.1130/GES00107.1
Cupples, W., and Van Arsdale, R. (2014). The preglacial “Pliocene” mississippi river. J. Geol. 122, 1–15. doi: 10.1086/674073
Cushing, E. M., BoswelI, E. H., and Hosman, R. L. (1964). General Geology of the Mississippi Embayment. Report No 448-B. Reston: U.S. Geological Survey.
Dart, R. L., and Swolfs, H. S. (1998). Contour mapping of relic structures in the precambrian basement of the reelfoot rift, North American mid-continent. Tectonics 17, 235–249. doi: 10.1029/97tc03551
Dhar, M. S., and Cramer, C. H. (2017). Probabilistic seismic and liquefaction hazard analysis of the mississippi embayment incorporating nonlinear effects. Seismol. Res. Lett. 89, 253–267. doi: 10.1785/0220170141
Frederiksen, N. O., Bybell, L. M., Christopher, R. A., Crone, A. J., Edwards, L. E., Gibson, T. G., et al. (1982). Biostratigraphy and paleoecology of lower paleozoic, upper cretaceous, and lower tertiary rocks in u.s. geological survey new madrid test wells, southeastern missouri. Tulane Stud. Geol. Paleontol. 17, 23–43.
Greenwood, M. L., Woolery, E. W., Van Arsdale, R. B., Stephenson, W. J., and Patterson, G. L. (2016). Continuity of the reelfoot fault across the cottonwood grove and ridgely faults of the new madrid seismic zone. Seismol. Soc. Am. Bull. 106, 2674–2685. doi: 10.1785/0120150290
Grimley, D. A., Larsen, D., Kaplan, S. W., Yansa, C. H., Curry, B. B., and Oches, E. A. (2009). A multi-proxy palaeoecological and palaeoclimatic record within full glacial lacustrine deposits, western Tennessee, USA. J. Q. Sci. 24, 960–981. doi: 10.1002/jqs.1275
Guccione, M. J., Mueller, K., Champion, J., Sheperd, S., Carlson, S. D., Odhiambo, B., et al. (2002). Stream response to repeated coseismic faulting, tiptonville dome, new madrid seismic zone. Geomorphology 43, 313–349. doi: 10.1016/s0169-555x(01)00145-3
Guo, L., Magnani, M. B., McIntosh, K., and Waldron, B. (2014). Quaternary deformation and fault structure in the northern mississippi embayment as imaged by near-surface seismic reflection data. Tectonics 33, 807–823. doi: 10.1002/2013tc003464
Hildenbrand, T. G. (1985). Rift structure of the northern Mississippi from the analysis of gravity and magnetic data. J. Geophys. Res. 90, 607–612. doi: 10.1029/JB090iB14p12607
Hildenbrand, T. G., Kane, M. F., and Hendricks, J. D. (1982). “Magnetic basement in the upper Mississippi embayment region- a preliminary report,” in Investigations of the New Madrid, Missouri, Earthquake Region, eds F. A. McKeown, and L. C. Pakiser, (Reston: U.S. Geological Survey), 39–54.
Howe, J. R. (1985). Tectonics, sedimentation, and hydrocarbon potential of the Reelfoot Aulacogen. Master’s Thesis, University of Oklahoma, Norman.
Howe, J. R., and Thompson, T. L. (1984). Tectonics, sedimentation, and hydrocarbon potential of the Reelfoot rift. Oil Gas J. 82, 174–190.
Johnston, A. C. (1996). Seismic moment assessment of earthquakes in stable continental regions: III. New Madrid 1811-1812, Charleston 1886, and Lisbon 1755. Geophys. J. Int. 126, 314–344. doi: 10.1111/j.1365-246X.1996.tb05294.x
Johnston, A. C., and Schweig, E. S. (1996). The enigma of the New Madrid earthquakes of 1811-1812. Annu. Rev. Earth Planet. Phys. 24, 339–384. doi: 10.1146/annurev.earth.24.1.339
Larsen, D., and Brock, C. F. (2014). Sedimentology and petrology of the eocene memphis sand and younger terrace deposits in surface exposures of western Tennessee. Southeast. Geol. 50, 193–214.
Liu, Z. (1997). Earthquake Modeling and Active Faulting in the New Madrid Seismic Zone. Ph.D. dissertation, Saint Louis University, St. Louis, MO.
Lumsden, D. N., and Caudle, G. C. (2001). Origin of massive dolostone: the upper knox model. J. Sediment. Res. 71, 400–409. doi: 10.1306/2DC4094E-0E47-11D7-8643000102C1865D
Lumsden, D. N., Cox, R. T., Van Arsdale, R. B., and Cupples, W. B. (2016). Petrology of pliocene Mississippi River alluvium: provenance implications. J. Geol. 124, 501–517. doi: 10.1086/686997
Magnani, M. B., Blanpied, M. L., Deshon, H. R., and Hornbach, M. J. (2017). Discriminating between natural versus induced seismicity from long-term deformation history of intraplate faults. Sci. Adv. 3:e1701593. doi: 10.1126/sciadv.1701593
Magnani, M. B., and McIntosh, K. (2009). Toward an understanding of the long-term deformation in the Mississippi Embayment. NEHRP Report No 08HQGR0089/08HQGR0090. Washington, D.C: National Science Foundation.
Markewich, H. H., Wysocki, D. A., Pavich, M. J., and Rutledge, E. M. (2011). Age, genesis, and paleoclimatic interpretation of the Sangamon/Loveland complex in the Lower Mississippi Valley, USA. Geol. Soc. Am. Bull. 123, 21–39. doi: 10.1130/b30208.1
Markewich, H. H., Wysocki, D. A., Pavich, M. J., Rutledge, E. M., Millard, H. T., Rich, F. J., et al. (1998). Paleopedology plus TL, 10Be, and 14C dating as tools in stratigraphic and paleoclimatic investigations, Mississippi River valley, U.S.A. Quat. Int. 51, 143–167. doi: 10.1016/s1040-6182(97)00041-4
Martin, R. V., and Van Arsdale, R. B. (2017). Stratigraphy and structure of the Eocene memphis sand above the eastern margin of the reelfoot rift in Tennessee, Mississippi, and Arkansas, USA. Geol. Soc. Am. Bull. 129, 970–996. doi: 10.1130/b31439.1
McKeown, F. A., Hamilton, R. A., Diehl, S. F., and Glick, E. E. (1990). diapiric origin of the blytheville and pascola arches in the reelfoot rift, east-central united states: relation to new madrid seismicity. Geology 18, 1158–1162.
Mueller, K., and Pujol, J. (2001). Three-dimensional geometry of the Reelfoot blind thrust: implications for moment release and earthquake magnitude in the New Madrid seismic zone. Bull. Seismol. Soc. Am. 91, 1563–1573. doi: 10.1785/0120000276
Nelson, K. D., and Zhang, J. (1991). A COCORP deep reflection profile across the buried Reelfoot rift, south-central United States. Tectonophysics 197, 271–291.
Obermeier, S. F. (1988). Liquefaction Potential in the Central Mississippi Valley. United States. Report No 84-515. Reston: United States Geological Survey.
Obermeier, S. F. (1989). The New Madrid Earthquakes: An Engineering-Geologic Interpretation of Relict Liquefaction Features. Report No 1336-B. Reston: U.S. Geological Survey.
Odum, J. K., Stephenson, W. J., Shedlock, K. M., and Pratt, T. L. (1998). Near-surface structural model for deformation associated with the February 7, 1812, New Madrid, Missouri, earthquake. Geol. Soc. Am. Bull. 110, 149–162.
Odum, J. K., Stephenson, W. J., Shedlock, K. M., Pratt, T. L., Collins, D. S., Rhea, S. B., et al. (1994). Possible fault(s) associated with the February 7, 1812 earthquake-induced Mississippi River waterfalls near New Madrid, Missouri. Geol. Soc. Am. 26:A471.
Parrish, S., and Van Arsdale, R. (2004). Faulting along the southeastern margin of the Reelfoot Rift in northwestern Tennessee revealed in deep seismic reflection profiles. Seismol. Res. Lett. 75, 782–791.
Pigati, J. S., McGeehin, J., Muhs, D. R., Grimley, D. A., and Nekola, J. C. (2015). Radiocarbon dating loess deposits in the mississippi valley using terrestrial gastropod shells (polygyridae, helicinidae, and discidae). Aeolian Res. 16, 25–33. doi: 10.1016/j.aeolia.2014.10.005
Potter, P. E. (1955a). The petrology and origin of the lafayette gravel: part 1. mineralogy and petrology. J. Geol. 63, 1–38. doi: 10.1086/626223
Potter, P. E. (1955b). The petrology and origin of the lafayette gravel: part 2. geomorphic history. J. Geol. 63, 115–132. doi: 10.1086/626238
Pryne, D., Van Arsdale, R., Csontos, R., and Woolery, E. (2013). Northeastern extension of the new madrid north fault–new madrid seismic zone, central united states. Bull. Seismol. Soc. 103, 2277–2294. doi: 10.1785/0120120241
Pryne, D. E. (2012). Stratigraphic and structural history of shallow Mississippi embayment sediments in Southeastern Missouri. Master’s thesis, University of Memphis, Memphis.
Purser, J. L. (1996). Shallow Seismic Reflection Survey Along the Southern Margin of Reelfoot Lake, Tennessee, and Regional Implications. Ph.D. thesis, University of Memphis, Memphis.
Purser, J. L., and Van Arsdale, R. B. (1998). Structure of the lake county uplift: new madrid seismic zone. Bull. Seismol. Soc. Am. 88, 1204–1211.
Rittenour, T. M., Blum, M. D., and Goble, R. J. (2007). Fluvial evolution of the lower Mississippi River valley during the last 100 k.y. glacial cycle: response to glaciation and sea-level change. GSA Bull. 119, 586–608. doi: 10.1130/b25934.1
Rodbell, D. T. (1996). Subdivision, Subsurface Stratigraphy, And Estimated Age Of Fluvial-Terrace Deposits in Northwestern Tennessee: U.S. Report No 2128. Reston: U.S. Geological Survey.
Rodbell, D. T., and Bradley, L. A. (1993). Logs of Exploratory Trenches Through Liquefaction Features on Late Quaternary Terraces in the Obion River Valley, Northwestern Tennessee. Miscellaneous Field Studies Report MF-2218. Reston: U.S. Geological Survey.
Russ, D. P. (1982). Style and significance of surface deformation in the vicinity of New Madrid, Missouri: Investigations of the New Madrid, Missouri, earthquake region. Report No 1236. Reston: U.S. Geological Survey, 95–114.
Saucier, R. T. (1987). Geomorphological Interpretations of Late Quaternary Terraces in Western Tennessee and their Regional Tectonic Implication. Report No 1336-A. Reston: U.S. Geologic Survey.
Saucier, R. T. (1994). Geomorphology and Quaternary Geologic History of the Lower Mississippi Valley. Vicksburg: U.S. Army Engineer Waterways Experiment Station.
Stahle, D. W., Van Arsdale, R. B., and Cleaveland, M. K. (1992). Tectonic signal in baldcypress trees at Reelfoot Lake. Tennessee. Seismol. Res. Lett. 63, 439–448.
Stephenson, W. J., Shedlock, K. M., and Odum, J. K. (1995). Characterization of the Cottonwood Grove and Ridgely Faults Near Reelfoot Lake, Tennessee, from High-Resolution Seismic Reflection Data. Report No 1538-I. Reston: U.S. Geological Survey.
Thomas, W. A. (1988). “The black warrior basin,” in Sedimentary Cover-North American Craton, ed. L. L. Sloss, (Boulder: Geological Society of America), 471–492.
Thomas, W. A. (1989). “The Appalachian-Ouachita orogen beneath the Gulf Coastal Plain between the outcrops in the Appalachian and Ouachita Mountains,” in The Appalachian-Ouachita orogen in the United States, eds R. D. Hatcher, W. A. Thomas, and G. W. Viele, (Boulder: Geological Society of America), 537–553. doi: 10.1130/dnag-gna-f2.537
Tuttle, M. P., Collier, J., Wolf, L. W., and Lafferty, R. H. III (1999). New evidence for a large earthquake in the New Madrid seismic zone between A.D. 1400 and 1670. Geology 27, 771–774.
Tuttle, M. P., Schweig, E. S. III, Campbell, J., Thomas, P. M., Sims, J. D., and Lafferty, R. H. III (2005). Evidence for New Madrid earthquakes in A.D. 300 and 2350 B.C. Seismol. Res. Lett. 76, 489–501. doi: 10.1785/gssrl.76.4.489
Tuttle, M. P., Schweig, E. S., Sims, J. D., Lafferty, R. H., Wolf, L. W., and Haynes, M. L. (2002). The earthquake potential of the New Madrid seismic zone. Bull. Seismol. Soc. Am. 92, 2080–2089. doi: 10.1785/0120010227
Tuttle, M. P., Wolf, L. W., Starr, M. E., Villamor, P., Lafferty, R. H. III, Morrow, J. E., et al. (2019). Evidence for large new madrid earthquakes about A.D. 0 and 1050 B.C. Central United States. Seismol. Res. Lett. 90, 1393–1406. doi: 10.1785/0220180371
Van Arsdale, R., Pryne, D., and Woolery, E. (2013). Northwestern extension of the reelfoot north fault near new Madrid, Missouri. Seismol. Res. Lett. 84, 1114–1123. doi: 10.1785/0220130067
Van Arsdale, R. B. (2009). Adventures Through Deep Time: The Central Mississippi River Valley and Its Earthquakes. Boulder: Special papers (Geological Society of America) 455, 107.
Van Arsdale, R. B., Balco, G., Bierman, P., Rood, D. H., Rovey, C., Lumsden, D. N., et al. (2014a). The pliocene mississippi river. Geol. Soc. Am. Abstr. 46:228.
Van Arsdale, R. B., Cupples, W. B., and Csontos, R. M. (2014b). Pleistocene-holocene transition in the central Mississippi river valley. Geomorphology 214, 270–282. doi: 10.1016/j.geomorph.2014.02.011
Van Arsdale, R. B., Bresnahan, R. P., McCallister, N. S., and Waldron, B. (2007). “The Upland complex of the central mississippi river valley: its origin, denudation, and possible role in reactivation of the new madrid seismic zone,” in Continental Intraplate Earthquakes: Science, Hazard, and Policy Issues, eds S. Stein, and S. Mazzotti, (Boulder: Geological Society of America), 177–192.
Van Arsdale, R. B., Cox, R. T., and Lumsden, D. N. (2019). Quaternary uplift in the lower Mississippi river valley. J. Geol. 127, 1–13. doi: 10.1086/700405
Van Arsdale, R. B., and Cupples, W. (2013). Late pliocene and quaternary deformation of the reelfoot rift. Geosphere 9, 1819–1831. doi: 10.1130/ges00906.1
Van Arsdale, R. B., Kelson, K. I., and Lumsden, C. H. (1995). Northern extension of the Tennessee reelfoot scarp into kentucky and Missouri. Seismol. Res. Lett. 66, 57–62. doi: 10.1785/gssrl.66.5.57
Van Arsdale, R. B., Purser, J. L., Stephenson, W., and Odum, J. (1998). Faulting along the southern margin of reelfoot lake, Tennessee. Bull. Seismol. Soc. Am. 88, 131–139.
Van Arsdale, R. B., and TenBrink, R. K. (2000). Late cretaceous and cenozoic geology of the new madrid seismic zone. Bull. Seismol. Soc. Am. 90, 345–356. doi: 10.1785/0119990088
Van Schmus, W. R., Schneider, D. A., Holm, D. K., Dodson, S., and Nelson, B. K. (2007). New insight into the southern margin of the Archean-Proterozoic boundary in the north-central United States based on U-Pb, Sm-Nd, and Ar-Ar geochronology. Precambrian Geol. 157, 80–105. doi: 10.1016/j.precamres.2007.02.001
Ward, A. C. (2016). Progress Toward Quaternary Displacement Rates on the Meeman-Shelby Fault and Joiner Ridge Horst, Eastern Arkansas. Ph.D. thesis, University of Memphis, Memphis.
Ward, A. C., Counts, R., Van Arsdale, R. B., Larsen, D., and Mahan, S. (2017). Quaternary displacement rates on the meeman-shelby fault and joiner ridge horst, eastern arkansas: results from coring mississippi river alluvium. Seismol. Res. Lett. 88, 442–455. doi: 10.1785/0220160171
Weathers, T. A. (2019). Geologic Mapping of Lake County, Tennessee. Master’s thesis, University of Memphis, Memphis.
Wolf, L. W., Tuttle, P. M., Browning, S., and Park, S. (2006). Case history: geophysical surveys of earthquake-induced liquefaction deposits in the new madrid seismic zone. Geophysics 71, 223–230. doi: 10.1190/1.2353801
Keywords: GIS, mapping, earthquakes, geology, hazards, structures, faults, Tennessee
Citation: Weathers T and Van Arsdale R (2019) Lake County, Tennessee, in the Heart of the New Madrid Seismic Zone. Front. Earth Sci. 7:273. doi: 10.3389/feart.2019.00273
Received: 09 July 2019; Accepted: 04 October 2019;
Published: 30 October 2019.
Edited by:
Alessandro Tibaldi, University of Milano-Bicocca, ItalyReviewed by:
Federico Pasquaré Mariotto, University of Insubria, ItalyPaul Mann, University of Houston, United States
Copyright © 2019 Weathers and Van Arsdale. This is an open-access article distributed under the terms of the Creative Commons Attribution License (CC BY). The use, distribution or reproduction in other forums is permitted, provided the original author(s) and the copyright owner(s) are credited and that the original publication in this journal is cited, in accordance with accepted academic practice. No use, distribution or reproduction is permitted which does not comply with these terms.
*Correspondence: Taylor Weathers, tayweathers@gmail.com