Download presentation
Presentation is loading. Please wait.

1
Lalita Bhattacharjee Nutritionist National Food Policy Capacity Strengthening Programme Food and Agriculture Organization of the United Nations Bangladesh Presented on 5 July 2011 at the Training Workshop on “Food Security Concepts, Basic Facts and Measurement Issues” 25 June to 7 July 2011 DIETARY ASSESSMENT AND LINKS WITH NUTRITIONAL ASSESSMENT # 6 C

2
OUTLINE Introduction National and household food consumption surveys Individual dietary assessment Rapid methods of dietary assessment, micronutrient assessment and FFQ Validation of dietary assessment Dietary diversity Conversion of dietary intakes to nutrients Conclusion

3
Dimensions and methods for assessing food security and under nutrition MethodsAvailability of food Access to food Consumption of food Utilization of nutrients FAO Method Household income & expenditure surveys Individual food consumption/ intake surveys Anthropometry Qualitative measures of food security

4
DIETARY ASSESSMENT AND NUTRITIONAL ASSESSMENT A DIETARY ASSESMENT is a comprehensive evaluation of a person's food intake. It is one of the established methods of nutritional assessment. Dietary assessment techniques range from food records to questionnaires and biological markers. NUTRITIONAL ASSESSMENT is more comprehensive and includes d determining nutritional status by analyzing the individual’s brief socio economic background, medical history, dietary, anthropometric, biochemical, clinical data and drug –nutrient interactions NUTRITIONAL STATUS is the measurement of the extent to which an individual’s physiologic need for nutrients is being met NUTRIENT INTAKE depends on actual food consumption which is influenced by factors such as economic situation, eating behaviour, emotional climate, cultural influences, effects of disease states on appetite and the ability to absorb nutrients NUTRIENT REQUIREMENTS are determined and influenced by age, sex, BMR, physiological status, activity patterns, physiologic stressors (infection, disease) and psychological stress
 and psychological stress.")
5
OPTIMAL NUTRITIONAL STATUS Source: Mahan and Stump, 2000

6
DIETARY ASSESSMENT PRINCIPLES Adequacy : a diet that provides enough energy and nutrients to meet the needs according to the recommended dietary allowances for good health Balance : a diet that provides enough, but not too much of each type of food Variety : a diet that includes a wide selection of foods within each food group food group Nutrient Density : a diet that includes foods that provide the most nutrients for the least number of calories (nutrient dense foods) Nutrient Density : a diet that includes foods that provide the most nutrients for the least number of calories (nutrient dense foods) Moderation : A diet that limits intake of foods high in sugar and fat Moderation : A diet that limits intake of foods high in sugar and fat
 Nutrient Density : a diet that includes foods that provide the most nutrients for the least number of calories (nutrient dense foods) Moderation : A diet that limits intake of foods high in sugar and fat Moderation : A diet that limits intake of foods high in sugar and fat")
7
Methods of assessing dietary intake National food supply data Household data Individual data (Food records, 24 hr dietary recall, FFQs, diet histories,food habit questionnaires, combined methods RAP - rapid assessment procedure ( focus groups to gather information on food behaviours, beliefs and intakes)
")
8
National and household food consumption Food consumption data collected at national, HH or individual levels Individual intake data required for assessing nutrient adequacy Food supply and HH data can provide useful information Food consumption assessment at national level based on FBS ( per capita availability, no individual variation in food intake) Food supply data useful
 Food supply data useful")
9
National and household level consumption Preferred source of food consumption surveys ( provide more information than FBS) Provide consumption characteristics of specific vulnerable groups including those from urban /rural populations HIES 2010
 Provide consumption characteristics of specific vulnerable groups including those from urban /rural populations HIES 2010")
10
SHARE OF FOOD GROUPS AS % OF DIETARY ENERGY SUPPLIES Source: Adapted from FBS, FAO, 2010

11
Comparative Per capita food intake (g) HIES 1991 -92 to 2010
 HIES to 2010")
12
Per capita/d intake of major food items (g)
")
13
Per capita dietary energy (kcal) intake (HIES, 2010)
 intake (HIES, 2010)")
14
Relative dietary energy contribution (En%) of cereals and rice to Bangladesh diet Source/YearEnergy intake (kcal) Cereal (g) En % Rice (g) En % HIES 20052238 452 70% 440 68% HIES 20102318 442 66% 416 64%
 of cereals and rice to Bangladesh diet Source/YearEnergy intake (kcal) Cereal (g) En % Rice (g) En % HIES % % HIES % %")
15
Potential key indicators to be mapped at national &sub- national levels by sector : FOOD AND NUTRITION Food intake indicators Average energy intake Average food intake of major food groups Daily per caput protein intake Percentage of energy from protein Daily per caput carbohydrate intake Percentage of energy from carbohydrates Daily per caput fat intake Percentage of energy from fat Percentage of protein from animal source Percentage of protein from vegetable source Dietary Energy Supply Percentage of undernourished population

16
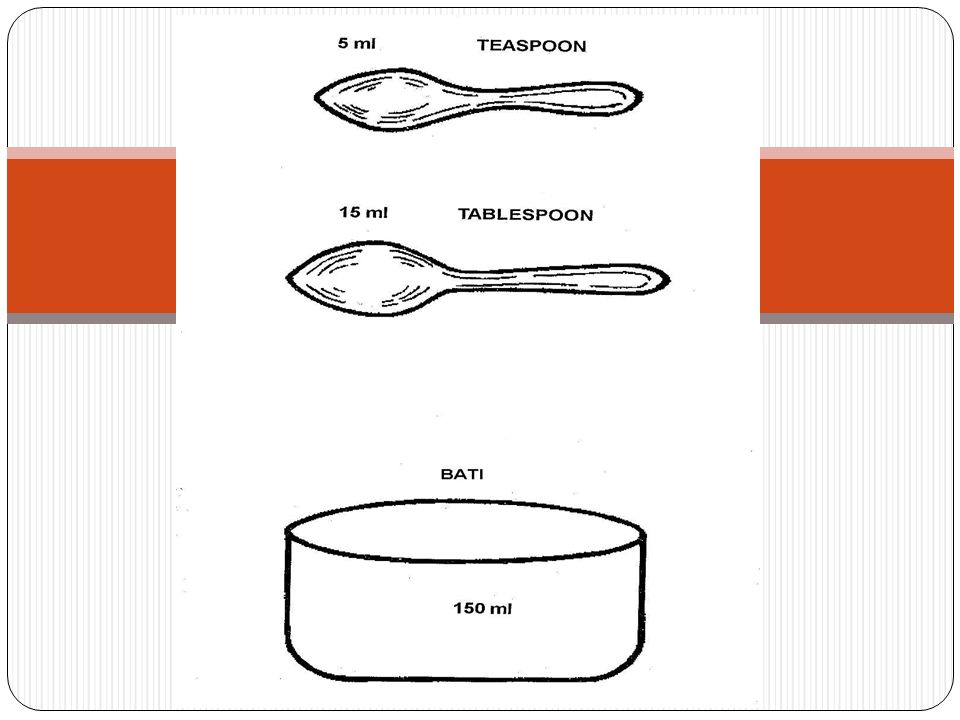
Assessment of individual intakes Dietary records Record all foods and beverages consumed over a specific time period ( 3-4 d) Amount consumed determined by weighing with a scale or measuring volume using standard cups and spoons Specific/special foods may be recorded (fat, vitamin A, iron rich) Total energy intake will require all foods to be recorded.
 Amount consumed determined by weighing with a scale or measuring volume using standard cups and spoons Specific/special foods may be recorded (fat, vitamin A, iron rich) Total energy intake will require all foods to be recorded.")
17
Assessment of individual intakes 24 hour recall : Recall all the foods and beverages consumed the previous day or 24 hours prior to the interview Interviewers should be knowledgeable about foods available in the market Regional and ethnic preparations and methods Interview conducted face –to-face, structured w/o probing questions Estimates of portion size are made using standardized cups and spoons Record of food amounts converted into nutrient intakes using food composition tables

18
Assessment of individual intakes Food frequency questionnaire (FFQ) Report usual frequency of consumption of each food item from a list of food items in reference to a specified period (past wk/mo/yr) Face to face interview, telephone or by self administration Describes dietary patterns or food habits not nutrient intake Semi quantified tools can obtain information on portion size using household measures
 Report usual frequency of consumption of each food item from a list of food items in reference to a specified period (past wk/mo/yr) Face to face interview, telephone or by self administration Describes dietary patterns or food habits not nutrient intake Semi quantified tools can obtain information on portion size using household measures")
19
Estimating average intake of nutrients Specification of portion size – standardized portions (Willet ) Description of portion size – small, medium, large (Block) Information on frequency and serving size allows for estimating nutrient intakes Food list should contain foods that contribute to majority of the nutrients/specific in the diet % adequacy of food groups % adequacy of RDA for energy and nutrients Used in epidemiological research to study diet disease relationships
 Description of portion size – small, medium, large (Block) Information on frequency and serving size allows for estimating nutrient intakes Food list should contain foods that contribute to majority of the nutrients/specific in the diet % adequacy of food groups % adequacy of RDA for energy and nutrients Used in epidemiological research to study diet disease relationships")
20
Assessment of individual intakes Diet history Collection of information on frequency of intake of various foods and usual meal pattern Entails detailed listing of foods and beverages consumed at each eating session 3 d - diet record as an independent check on food intake Methods of preparation

21
Rapid methods for community dietary assessment Dietary assessment of HHs with children under 5s Rapid assessment survey (focus group interviews, selected target group interviews IYCF practices, Social customs and food beliefs, behaviours & intakes Key informants – community leaders, local shop owners or health personnel Small clusters of women 5-6 women sufficient for FGD development of culture -specific relevant food usage list Linking food intake data with weighing /measuring of children & mother Derive mother’s BMI from standard tables

22
Strengths and limitations of dietary assessment methods Relies on memory; may require trained interviewer ( need for food list & community based training No literacy needed; Diet history may rely on memory; may require trained interviewer ( need for food list; std menu types; community based training) Rapid &low cost; does not alter intake behaviour Food habit questionnaire Relies on memory; requires complex calculations to estimate frequencies; requires literacy, doe not quantify intake ( need for exhaustive food list; need for manual tally type calculations) Inexpensive ; preferred for nutrients with high day-to-day variability; does not alter intake behaviour; lower respondent burden; epidemiological research to study diet-disease relationships FFQs Relies on memory; requires skilled interviewer; does not reflect the usual dietary intake ( need for food list, std menu types; need for community based training ) Immediate recall period, easy to obtain information; since interviewers administer tool & records the responses, literacy is not a problem, respondent burden minimal; does not alter intake behaviour; wide range of use 24 hr recall High participation burden; requires literacy; may alter intake behaviour ( ?? community use ) Does not rely on memory; open endedFood record LimitationsStrengthsMethod
 Does not rely on memory; open endedFood record LimitationsStrengthsMethod.")
23
Selecting appropriate methods for community dietary assessment RAP –low cost, primary method for collecting dietary data (locally available /commonly consumed foods, dietary habits, behaviour) Household surveys – provide data on foods consumed by HH not individuals Point to which foods are major contributors to nutrients of particular concern ( identify vulnerability/at risk of dietary deficiency - e.g no fresh vegetables/fruits, lack of DGLV/YOV–lack of vitamin C & A in diet; inadequate presence of dietary enhancers for iron absorption??) Food record and 24 hr recall methods of choice for estimating mean intakes Combine with quantitative dietary intake methods to obtain individual nutrient intakes
 Household surveys – provide data on foods consumed by HH not individuals Point to which foods are major contributors to nutrients of particular concern ( identify vulnerability/at risk of dietary deficiency - e.g no fresh vegetables/fruits, lack of DGLV/YOV–lack of vitamin C & A in diet; inadequate presence of dietary enhancers for iron absorption ) Food record and 24 hr recall methods of choice for estimating mean intakes Combine with quantitative dietary intake methods to obtain individual nutrient intakes")
24
Simplified assessment for specific nutrients FFQ Simple, short questionnaires Assessing intakes of specific nutrients to study diet –disease relationships Questionnaires should focus on assessing intakes of specific nutrients (e.g calcium and osteoporosis, anti oxidants and CD –cancer, heart disease, V&F and certain cancers, specific micronutrients and VAD, anemia; iodized salt, sea foods and fortified foods and IDD) Questionnaires need to be tested in diverse populations to assess validity VS, HKI Simplified FFQ
 Questionnaires need to be tested in diverse populations to assess validity VS, HKI Simplified FFQ")
25
Validation of dietary methods Need to establish validity and reliability Validity - how well it measures what it purports to measure (accuracy) Reliability – how well it agrees on retesting under the same conditions (consistency) Assessment of reliability is feasible, validity poses a problem Gold standard established – dietary record/direct observation of subject’s consumption Reference for validation
 Reliability – how well it agrees on retesting under the same conditions (consistency) Assessment of reliability is feasible, validity poses a problem Gold standard established – dietary record/direct observation of subject’s consumption Reference for validation")
26
Relative validation Unlike other methods, 24 hr recall is more susceptive to direct validation Since time covered is short and limited, direct observation and measurements of intake are possible and also practical Studies that compared 24 hr recall with observation and weighed duplicate meals have found that that the 2 methods yield similar results Dietary intake varies from day to day, single recall may not be representative Many studies confirm that variations within individuals, mean intake of group was not found to be significantly different from day to day Inter individual variability is less marked than intra individual variation Value of the method in establishing average intake levels of groups is reasonably well established

27
Errors in dietary surveys RANDOM (reduced reliability) Generate larger total variances Reduce the statistical power to detect association between intake and a disease Accentuate the estimates of possible associations SYSTEMATIC (bias) Represent greater hazards than random errors Alter results Very little can be done to correct for their effect Structure of errors differs according to type of survey method Methods relying on simple recall or ability to provide reliable estimates of usual eating habits tend to be more prone to systematic errors while methods that rely on direct measurement are associated with random errors
 Generate larger total variances Reduce the statistical power to detect association between intake and a disease Accentuate the estimates of possible associations SYSTEMATIC (bias) Represent greater hazards than random errors Alter results Very little can be done to correct for their effect Structure of errors differs according to type of survey method Methods relying on simple recall or ability to provide reliable estimates of usual eating habits tend to be more prone to systematic errors while methods that rely on direct measurement are associated with random errors")
28
SOURCES OF ERROR IN DIETARY ASSESSMENT METHODS (INDIVIDUAL INTAKES) Source of errorWeighed food records Estimated food weight records 24 hr recallDietary history and FFQs FCT /recipe books ++++ Food coding++++ Wrong weight of foods _+++ Reporting error__++ Variation of diet with time +++_ Wrong frequency___+ Modified eating pattern ±±__ Response bias±±±± Sampling bias++++ Source: Anna Ferro –Luzzi in FAO, 2002
 Source of errorWeighed food records Estimated food weight records 24 hr recallDietary history and FFQs FCT /recipe books ++++ Food coding++++ Wrong weight of foods _+++ Reporting error__++ Variation of diet with time +++_ Wrong frequency___+ Modified eating pattern ±±__ Response bias±±±± Sampling bias++++ Source: Anna Ferro –Luzzi in FAO, 2002")
29
Illustration of association between dietary adequacy and anthropometry 100 80 20Total 70 0% > -2SDs 30 10 20% <-2SDs Total% adequate% inadequatePrevalence of UW Source : Mason, 2002 in “Measurement and Assessment of Food Deprivation and Undernutrition”, FAO

30
Dietary diversity (DD) : when to measure Objective Timing Assessment of the typical diet of HH/individuals In rural, agriculture based communities In non agriculture based communities When food supplies are still adequate (maybe up to 4-5 mo after the main harvest) Looking at DD at different points in the agricultural cycle is one way of investigating seasonality of food security In many areas there are important seasonal differences in dietary patterns. For a more complete assessment of usual diet, DD should be measured during different seasons Anytime of the year (if seasonality is not an issue)
.")
31
Dietary diversity (DD) : when to measure Objective Timing Assessment of the food security situation in rural, agriculture-based communities During the period of greatest food shortage, such as immediately prior to the harvest or immediately after emergencies or natural disasters This may also serve as a baseline for monitoring change for investigating seasonality Assessment of the food security situation in non- agricultural communities At the moment of concern to identify a possible food security problem May also serve as a baseline for monitoring changes due to an intervention Monitoring of food security/nutrition programmes or agricultural interventions such as crop and livelihood diversification Repeated measures to assess impact of the intervention on the quality of the diet, conducted at the same time of year as the baseline (to avoid interference due to seasonal differences)
 : when to measure Objective Timing Assessment of the food security situation in rural, agriculture-based communities During the period of greatest food shortage, such as immediately prior to the harvest or immediately after emergencies or natural disasters This may also serve as a baseline for monitoring change for investigating seasonality Assessment of the food security situation in non- agricultural communities At the moment of concern to identify a possible food security problem May also serve as a baseline for monitoring changes due to an intervention Monitoring of food security/nutrition programmes or agricultural interventions such as crop and livelihood diversification Repeated measures to assess impact of the intervention on the quality of the diet, conducted at the same time of year as the baseline (to avoid interference due to seasonal differences)")
32
Dietary diversity : Key steps Activities prior to data collection Translation and adaptation steps Review Key informant and community meetings Refining the food lists and translations Use of local names Technical issues Minimum quantities Individual food items that can be classified into more than one food group Mixed dishes Training Instructions for administering the questionnaire Household level Analyzing dietary diversity data Dietary diversity scores

33
DIETARY DIVERSITY SCORES : Aggregation of food groups to create HDDS and WDDS HDDS WDDS Question no.Food GroupQuestion no.Food Group 1.Cereals1,2Starchy staples 2.White tubers and roots4Dark green leafy vegetables 3,4,5Vegetables3,6 and red palm oil as applicable Other vitamin A rich fruits and vegetables 6,7Fruits5,7Other fruits and vegetables 8,9Meat8Organ meat 10Egg9,11Meat and fish 11Fish and other sea food10Egg 12Legumes, nuts and seeds12Legumes, nuts and seeds 13Milk and milk products13Milk and milk products 14Oils and fats 15Sweets 16Spices, condiments and beverages

34
Food groups consumed by ≥ 50 % HH by diversity tertiles Lowest dietary diversity (≤ 3 food groups ) Medium dietary diversity ( 4 and 5 food groups) High dietary diversity (≥ 6 food groups) Cereals Green leafy vegetables Vitamin A rich fruitOilVitamin A rich fruit Oil Other vegetables Fish Legumes, nuts and seeds Source: FAO, 2010
 Medium dietary diversity ( 4 and 5 food groups) High dietary diversity (≥ 6 food groups) Cereals Green leafy vegetables Vitamin A rich fruitOilVitamin A rich fruit Oil Other vegetables Fish Legumes, nuts and seeds Source: FAO, 2010")
35
Measures and use of DD Dietary diversity as a measure of HH access and food consumption can be triangulated with other food related information Gives a holistic picture of food and nutrition security status across a broader area DD being used increasingly to provide indicators of HH access and individual dietary quality Contextual use : Baseline and impact assessment, national surveys, surveillance systems, M&E of programmes and policies Phase classification for identifying emergencies

37
Easy way to count your calories (Measures providing 100 kcal Cereals : 30 g ( 1/5 cup) Bread : 40 g ( 2 slices) Pulses : 30 (2 Tbsp) Leafy vegetables (sak): 250 g ( 2 small bunches) Other vegetables : 400 g (4 cups) Potato : 100 ( 1 cup) Nuts/oilseeds : 20 g (handful) Fruit : 150 g/ 1-2 fruits Milk/Curd :150 ml ( 1 cup) Butter milk (ghol) : 670 ml ( 4 cups) Channa/paneer/cheese : 30 g (1 pkt) Egg : 60 g ( 1 medium size) Chicken : 90 g ( 3 small pieces) Mutton: 85 g Fish (lean) 100 g Fish (fatty) 60 g Shrimp : 30 g Prawn : 100 g Sugar : 25 g ( 5 tsp) Spices : 40 g ( 6 tsp) Oil/ghee : 10 g (2 tsp) Butter : 15 g (1 Tbsp)
 Bread : 40 g ( 2 slices) Pulses : 30 (2 Tbsp) Leafy vegetables (sak): 250 g ( 2 small bunches) Other vegetables : 400 g (4 cups) Potato : 100 ( 1 cup) Nuts/oilseeds : 20 g (handful) Fruit : 150 g/ 1-2 fruits Milk/Curd :150 ml ( 1 cup) Butter milk (ghol) : 670 ml ( 4 cups) Channa/paneer/cheese : 30 g (1 pkt) Egg : 60 g ( 1 medium size) Chicken : 90 g ( 3 small pieces) Mutton: 85 g Fish (lean) 100 g Fish (fatty) 60 g Shrimp : 30 g Prawn : 100 g Sugar : 25 g ( 5 tsp) Spices : 40 g ( 6 tsp) Oil/ghee : 10 g (2 tsp) Butter : 15 g (1 Tbsp)")
38
Energy expenditure of selected activities - kcal expended/minute ActivityKcal/min/ kg 45kg55kg65kg Sitting quietly0.0210.91.21.4 Walking normal pace 0.0803.64.45.2 Writing, sitting 0.0291.31.61.9 Vacuuming cleaning/ mopping 0.0482.22.63.1 Ironing0.0642.93.54.2 Running 11.5 min/mile 0.1356.17.48.8 Cycling 5.5 mph 0.0642.93.54.2 Basketball0.1386.27.69.0

39
Estimating energy requirements Sedentary work : 30 -35kcal/kg/BW Moderately active : 40kcal/kg/BW Very physically active : 50kcal/kg/BW Suppose a person’s ideal BW is 60 kg 40 x 60 = 2400 kcal = energy requirement Calculation of approximate energy requirement BMR : 1 x24x 60 = 1440 kcal Physical activity = 800 kcal SDA = 250 kcal Energy requirement = 2490 kcal

40
Normogram for determining BMI

41
Conclusions Need to use core indicators linked to food security & nutrition outcomes; Identify food and nutrition vulnerability through information on food consumption patterns Need to obtain information on intra household distribution of food for accurate assessment of individual intakes; Differential nutritional status associated with differences in morbidity or illness or other factors within HHs provides valuable information on food distribution Knowledge of HH food allocation patterns and underlying reasons for food / diet related behaviour, so that effectiveness of nutrition interventions can be improved.

42
Conclusions Choice of method : Information needed, resources available Food/nutrients of primary interest, group/vs individual data, absolute /vs relative intake, population characteristics Include statistical expertise while designing survey and questions Can provide qualitative data on dietary intake of HH Can be combined with other methods to obtain individual quantitative data When absolute vs relative estimates are required, food record, 24 dietary recall are methods of choice For day –to-day variability – FFQ useful DD – dietary patterns/habits/semi qualitative can be quantified Dietary assessment is essential to identify populations at risk Useful for informing and developing appropriate policies and programmes to improve nutritional status

Similar presentations


 Jawaharlal Nehru University (JNU) New Delhi India>")


 Mrs. Sarah Jacob Rtd. Head, Department of Dietetics Christian Medical College Vellore.>")

 Jamai-Osmania (P.O.), Hyderabad.>")


 Family Food History 1.Describe what it was like eating in your family as you grew up. Did you all sit down and eat or.>")