Jelte M. Wicherts and Conor V. Dolan, University of Amsterdam (2010)
Measurement invariance with respect to groups is an essential aspect of the fair use of scores of intelligence tests and other psychological measurements. It is widely believed that equal factor loadings are sufficient to establish measurement invariance in confirmatory factor analysis. Here, it is shown why establishing measurement invariance with confirmatory factor analysis requires a statistical test of the equality over groups of measurement intercepts. Without this essential test, measurement bias may be overlooked. A re-analysis of a study by Te Nijenhuis, Tolboom, Resing, and Bleichrodt (2004) on ethnic differences on the RAKIT IQ test illustrates that ignoring intercept differences may lead to the conclusion that bias of IQ tests with respect to minorities is small, while in reality bias is quite severe.
The valid and fair use of psychological tests in government, health care, business, and education requires that tests measure what they are supposed to measure, and that individual differences in test scores do not reflect irrelevant characteristics associated with membership of demographic groups (e.g., ethnicity, gender). In the Standards for Educational and Psychological Testing (AERA, APA, & NCME, 1999, henceforth the Standards), test fairness means “examinees of equal standing with respect to the construct the test is intended to measure should on average earn the same test score, irrespective of group membership” (p. 74). For instance, suppose members of an ethnic minority group underperform on an IQ test, because of their unfamiliarity with certain words in the instruction texts. If, as a consequence, this test underestimates IQ of a group by, say, one-third of a SD (i.e., 5 IQ points), this test would generally be considered unsuitable for use in (high-stakes) decisions in education. Moreover, individual test scores based on such a test should be interpreted very cautiously, if at all. Fortunately, various statistical methods have been developed that can be used to detect measurement bias at both the scale and the item level (e.g., Millsap & Everson, 1993; Raju, Laffitte, & Byrne, 2002). For instance, items in educational achievement tests are commonly tested for Differential Item Functioning (DIF; Holland & Wainer, 1993). Since DIF may be the result of trait-irrelevant effects on which the groups differ (e.g., because a math item contains words unfamiliar to minorities), items displaying DIF are potentially unfair. This paper is concerned with establishing measurement invariance (i.e., unbiasedness) of psychological or educational tests at the level of scales by means of multi-group confirmatory factor analysis (MGCFA). Although this method is widely used to assess invariance or equivalence across groups, many applications do not include tests of all measurement parameters in the MGCFA model (Vandenberg & Lance, 2000; Wicherts, 2007). The aim of this paper is to show that establishing measurement invariance in MGCFA requires that not only factor loadings (and residual variances) but also measurement intercepts are invariant across groups (Meredith, 1993). The failure to test for between-group differences in measurement intercepts may lead to incorrect conclusions regarding the appropriateness of tests for certain groups. Group differences in intercepts are indicative of a trait-irrelevant depression or elevation of test scores within a particular group. For example, suppose a test battery aimed at measuring mathematical proficiency is composed of three subtests, one of which also depends on language ability. If one group of test-takers averages lower language ability than another group, this will result in measurement bias with respect to the former. Such bias may not be detected in analyses that do not involve measurement intercepts.
In the Netherlands, several studies of invariance have been concerned with the suitability of Dutch intelligence tests for ethnicminorities who on average score lower than Dutch majorities (e.g., Helms Lorenz, Van de Vijver, & Poortinga, 2003; Te Nijenhuis, Evers, & Mur, 2000; Te Nijenhuis, Tolboom, Resing, & Bleichrodt, 2004; Te Nijenhuis & van der Flier, 1997). These minority groups are mostly composed of firstor second-generation immigrants, who are not necessarily as proficient in Dutch as native speakers. This may have a negative effect on their scores on cognitive ability tests. For instance, Te Nijenhuis et al. (2004) studied measurement bias on a Dutch intelligence test (i.e., RAKIT) with respect to several groups of minority children. The results of their analyses, which ignored intercept differences, suggested “only little bias” (Te Nijenhuis et al., 2004, p. 24) with respect to minorities. In the current paper, we employ MGCFA to shed light on possible intercept differences between majority and minority children on the RAKIT.
Measurement Invariance
Various tutorials have been written on how to investigate measurement invariance (or equivalence) using confirmatory factor analysis (Little, 1997; Lubke, Dolan, Kelderman, & Mellenbergh, 2003a; Ployhart & Oswald, 2004). Most tutorials, although not all (e.g., Van de Vijver & Leung, 1997), stress the importance of modeling the measurement intercepts when assessing measurement invariance across groups. However, Wicherts (2007) considered 110 studies of measurement invariance with MGCFA that were published in various psychology journals in 2005. He found that only in 27 of these studies (24.5%) intercept differences across groups were tested. In a total of 69 studies it was concluded (in the abstract) that measurement invariance across groups was established, mostly because factor loadings appeared to be invariant over groups. However, only in 16 of these studies (25%) intercept differences could be ruled out as a potential source of measurement bias. In the remaining 75% of these MGCFA studies, measurement invariance was claimed without a test of intercept differences. The ignoring of intercept differences may be due in part to the fact that the investigation of mean differences in MGCFA is not part of many structural equation-modeling courses (Stapleton & Leite, 2005). Although the equality over groups of the factor loading estimates is a necessary condition for measurement invariance, it is insufficient for attributing test score differences over groups to latent differences in constructs.
An important requirement of measurement invariance is that the expected (manifest) test scores of a person who has a certain level of latent ability (or abilities), are independent of group membership. Suppose, for instance, that a minority student and a majority student are equally proficient in mathematics. A systematic difference in their observed scores on a mathematics test would suggest the test is biased with respect to ethnicity. This is because measurement invariance requires that the expected test score given a certain latent ability, should not be influenced by, or dependent on, characteristics other than the latent ability. To formalize this, let the variable Y denote the manifest test scores, and let η denote a given fixed level on the latent trait that underlies the scores on Y. The expected test scores (denoted E(Y)), should depend on latent ability, but not on ethnicity. So, if measurement invariance holds, and we condition on the level of the latent trait score (i.e., we choose a fixed value η), the conditional expected scores should be equal for majority and minority students:
E(Y | η, majority) = E(Y | η, minority) = E(Y | η). (1)
Note that this does not imply that the ethnic groups do not differ with respect to latent ability. Equation 1 concerns the conditional expectation given a fixed level of η and ethnicity; it does not say anything about the conditional expectation given ethnicity – that is, E(Y | majority) does not necessarily equal E(Y | minority).
Mellenbergh (1989) proposed a general definition of measurement invariance which is expressed in terms of the complete (conditional) distribution of Y, denoted by f(Y |.). This definition states that measurement invariance with respect to v holds, if:
f (Y | η, v) = f (Y | η) , (for all Y, η, v), (2)
where v denotes a grouping variable, which gives rise to group membership (e.g., gender, ethnicity, cultural group). This definition does not depend on the nature of the distribution of the test scores, Y, which may be either continuous or discrete. But if test scores are (approximately) multivariate normally distributed, Equation 2 implies that, conditional on the latent trait scores, the expected values (i.e., Equation 1), the covariances between test scores (i.e., internal structure; cf. Standard 7.1), and the amount of variance unrelated to the latent trait(s) (cf. Standard 7.2) are equal across groups. By adopting the linear confirmatory factor model as a measurement model (Mellenbergh, 1994), all these requirements of measurement invariance can be tested readily. Measurement invariance requires that the relationship between the test score(s) (i.e., measurement of ability) and the latent trait(s) (i.e., latent ability) of a person should not depend on group membership (Mellenbergh, 1989; Millsap & Everson, 1993).
In the case of a dichotomous (e.g., right/wrong) item measuring one latent trait (e.g., mathematical ability), the definition of invariance in Equation 2 requires that the probability of answering that item correctly (i.e., the expected value) given a particular latent trait score is identical for members of different groups. Within (parametric) item response theory, an item is considered to be unbiased if the parameter that links this probability to the latent trait is invariant over groups. For instance, the difficulty parameter of an item in a one-parameter logistic model should be identical across groups (e.g., Holland & Wainer, 1993). This aspect of item fairness is well known; it is explicitly mentioned in the Standards (i.e., Standard 7.3), and most studies of test fairness or test equivalence nowadays involve a test of DIF. However, measurement invariance also applies to the level of subtests in, for example, an intelligence test battery. That is, in most uses of such multivariate tests, the measurement aim exceeds the specific abilities tapped by particular subtests. Instead, the aim is to measure the ability that is common to several subtests. For instance, in IQ batteries such as the Wechsler scales (i.e., WAIS-III; WISC-IV; Wechsler, 1997, 2004), the measurement aim is either to get an indication of general intelligence (full-scale IQ), and/or of one of the several broad abilities as expressed in so-called index scores (e.g., Verbal Comprehension, Fluid Reasoning, Perceptual Organization, Working Memory, and Processing Speed). Moreover, norm tables are usually not related to specific subtest scores, but to these broad abilities. With such a measurement aim, measurement invariance requires that the expected subtest score conditional on latent ability (e.g., Fluid Reasoning) be identical across groups.
The confirmatory factor model with which measurement invariance can be tested, may be viewed as a measurement model in which the observed test or indicator scores (e.g., subtest scores) are regressed upon the scores on the latent, unobserved, construct η (Mellenbergh, 1994). As in ordinary linear regression, the model includes the following measurement parameters for each indicator: a regression weight or factor loading λ, a residual term ε, and an intercept τ . The test score y1 of person j in group i is predicted by the score on the latent variable or factor η (e.g., fluid reasoning): [1]
y1ij = τ1i + λ1iηij + ε1ij. (3)
Note that the expected value of the residual ε is assumed to equal zero, and that the residual is assumed to be uncorrelated with the factor score (as well as with the residuals of other indicators). The residual term of an indicator contains both random measurement error and specific factors tapped by that particular indicator (i.e., all uncommon sources of variance; DeShon, 2004; Meredith & Horn, 2001). The measurement model can be fitted given a sufficient number of indicators (Bollen, 1989). The intercept is the value of y corresponding with the point where η = 0. In many applications (e.g., single-group studies) mean differences are not of interest and measurement intercepts are not modeled. However, in establishing measurement invariance over groups, the estimates of measurement intercepts and factor mean differences have to be incorporated in the analyses (Meredith, 1993).
With this measurement model in place, we consider the implications of measurement invariance graphically. The top panel of Figure 1 displays the regression lines relating the scores on a (sub)test to factor scores in two groups. In this panel factor loadings are identical in both groups, but intercepts are different. As can be seen, the intercept in Group 2 is lower than the intercept in Group 1. The consequences of this group difference in intercept are evident. Regardless of ability level, members of Group 2 with a certain ability score lower than members of Group 1 with the same latent ability. Clearly, an intercept difference violates measurement invariance. The underestimation in Group 2 in this case is equal to the group difference in measurement intercepts (i.e., τ11 − τ12). Because the underestimation of ability in Group 2 is equal for all ability levels, this situation is denoted by uniform bias (Mellenbergh, 1982). Depending on their direction, intercept differences may lead to an overestimation or an underestimation of group differences in latent ability. Note that this scenario is equivalent to uniform DIF in IRT; for example, a group difference in item difficulty in a one- or two-parameter logistic model.
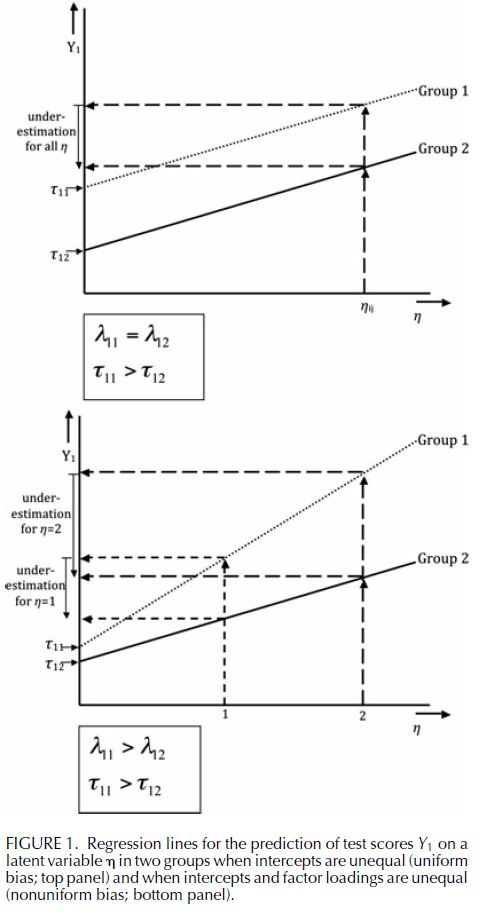
The bottom panel in Figure 1 displays a scenario in which factor loadings differ over groups. If this occurs, measurement bias depends on ability level, which is denoted nonuniform bias (Mellenbergh, 1982). This is equivalent to nonuniform DIF in IRT, for example, an item that exhibits group differences in the discrimination parameter in a two-parameter logistic model. Only when factor loadings and intercepts are group-invariant can we conclude that between-group mean differences on the indicators are a function of a latent group difference on the mean of the latent factor. A further requirement of the general definition of measurement invariance in Equation 2 is that the variance around the expected values is group-invariant. Therefore, residual variances should also be equal across groups for measurement invariance to hold (DeShon, 2004; Lubke & Dolan, 2003; Meredith, 1993).
Under measurement invariance, groups do not differ with respect to the relation between manifest test scores and the latent trait(s), and any group differences in manifest test scores are due to group differences at the latent level, as expressed in group differences in factor means and (co)variances. Therefore, under measurement invariance all measurement parameters should be invariant over groups that constitute a situation denoted by strict factorial invariance (Meredith, 1993). The invariance of measurement parameters implies that the same constructs are being measured across groups. The tenability of measurement invariance can be studied by comparing the fit of models with and without the restriction that parameters are equal across groups. The preferred method is fitting a series of increasingly restrictive models, which are presented in Table 1 [2] (cf. Lubke et al., 2003a; Vandenberg & Lance, 2000). Because of the nesting of these increasingly restrictive models, equality over groups of each of the measurement parameters may be tested statistically by means of a likelihood ratio test or by using other indices of fit. Note that strong factorial invariance (Meredith, 1993) entails a model in which measurement intercepts and factor loadings are restricted to be equal across groups, while residual variances are allowed to differ between groups. We do not pursue that particular model here (see discussions by DeShon, 2004; Lubke & Dolan, 2003).

When testing for measurement invariance in MGCFA, mean structure and covariance structure are modeled simultaneously (Meredith, 1993). Factor loadings play an essential role in the connection between these two structures. The crux of the method to detect group differences in intercepts lies in the relation between factor loadings and between-group differences on the indicators. Namely, if between-group differences in the means of the indicators are due to between-group differences in the latent variable, one would expect that the relative size of between-group differences on the indicators is collinear with the factor loadings. That is, the higher a subtest’s factor loading, the better the scores on this subtest are predicted by the common factor, and the better this test is able to show (any) between-group difference at the latent level.
Thus, if mean group differences on the subtests are due to mean differences on the factor, this means that, whatever mean score differences we might find, these should be expressed in a way that is compatible with the relative size of factor loadings. On the other hand, if the between-group difference on a subtest is not in line with the relative size of its factor loading, this implies that the between-group difference on this subtest could not be solely due to a between-group difference on the common factor. If such occurs, there is a group difference in the intercept on this subtest. Thus, different intercepts capture any between-group mean difference, which cannot be explained by between-group mean differences on the factor. [3] If intercepts differ across groups, they should be estimated freely across groups. If there remain sufficient invariant indicators of a factor, this enables an unbiased estimation of factor mean difference, as well as an estimation of the degree of uniform bias on the biased indicator.
Meaning of Intercept Differences
According to the Standards, “bias in tests [. . .] refers to construct-irrelevant components that result in systematically lower or higher scores for identifiable groups of examinees” (p. 76). A difference in intercepts suggests that the mean difference between groups on that particular indicator cannot be accounted for by mean differences on the factor(s) that a test is supposed to measure. One may look at intercept differences as occurring because of a group difference in the specific ability tapped by the corresponding indicator (Meredith & Horn, 2001; Millsap & Meredith, 2007). Alternatively, there may be an additional factor “out there” that necessarily differs across groups, which results in a mean effect on that indicator (Lubke, Dolan, Kelderman, & Mellenbergh, 2003b). This notion of additional factors is closely associated with developments in multidimensional DIF (Roussos & Stout, 1996). Note that if the measurement aim is restricted to the specific ability tapped by the subtest (e.g., vocabulary knowledge), then group differences in intercepts as found in a factor analysis with other subtests may reflect “genuine” group differences in this targeted latent ability. Such will not be considered uniform bias, because with this specific measurement aim, the latent variable against which invariance is defined (cf. Equations 1 and 2) would include the subtest specific ability. However, if the measurement aim is related to broad common factors, as in most applications of IQ testing, then a group difference in intercepts may highlight a group mean difference in the subtest specific ability. This would be considered uniform bias because the targeted latent variable would then be the broad common factor, which by definition is uncorrelated with the specific latent ability tapped by the subtest (i.e., the systematic part of the residual in Equation 3). [4]
An intercept difference may be due to DIF within the subtest, for example, because certain words in the items of the corresponding subtest may be less familiar to members of one of the groups. However, intercept differences may also be due to group differences in the specific ability tapped by the subtest. For instance, in two studies of gender differences on the WAIS-III in Spain and The Netherlands, it was found that the intercept of the Information subtest (which loads on Verbal Comprehension) was higher for males than for females (Dolan et al., 2006; Van Der Sluis et al., 2006). This is in line with a reported gender difference in general knowledge (e.g., Lynn & Irwing, 2002), which suggests that males outperform females on Information. Such a subtest specific gender difference is not in line with the (nonsignificant) gender difference on the factor (i.e., Verbal Comprehension), resulting in an intercept difference. Other measurement artifacts may also give rise to intercept differences, for example, the performance-lowering effect of stereotype threat on test performance of stigmatized groups (Wicherts, Dolan, & Hessen, 2005).
Illustration: IQ and Minority Children
Ignoring intercept differences between groups may have serious consequences, because such intercept differences may result in an underestimation of ability in a particular group. We illustrate this by means of a re-analysis of a study by Te Nijenhuis et al., who investigated whether a Dutch children’s intelligence test (RAKIT) was suitable for children of immigrants from Turkey, Morocco, and the former Dutch colonies. In what appears to be a textbook example of a measurement invariance study, Te Nijenhuis et al. (2004) went to great length in studying invariance of the RAKIT across the different ethnic groups. They used the Mantel-Haenszel method to study DIF, an analysis of differential prediction using school grades as a criterion, and MGCFA. Although they investigated the equality of factor loadings in the latter analyses by using a likelihood ratio test and a congruence measure, Te Nijenhuis et al. did not investigate whether measurement intercepts were equal across groups. Based on the findings of small DIF effects, only slight differential prediction, and group-invariant factor loadings, these authors concluded that the RAKIT “is highly, though not perfectly, valid for the assessment of immigrant children” (p. 22). Our aim is to test for intercept differences in order to verify this claim of measurement invariance. We restrict our attention to a group of children of Moroccan and Turkish descent, aged 7, who were compared to a representative sample of Dutch majority children of the same age.
Method
Participants. The test scores of a representative sample of 196 majority children were used as comparison to the test scores of 131 children from Moroccan (N = 60) and Turkish (N = 71) descent. In view of power concerns we pooled these two minority groups for the factor analyses (analyses per group gave similar results). Overall, the mean subtest performance did not differ significantly between the two immigrant groups: a MANOVA on the subtest scores resulted in a nonsignificant multivariate effect for group: F (12, 118) = 1.685, p > .05. In addition, a Box test showed that covariance matrices did not differ between Turkish and Moroccan children: F (78, 49603) = 1.08, p > .05. All minority children have followed education in Dutch. The minority sample is not explicitly sampled to be representative, but the children are from various schools in both rural and urban areas. The samples do not differ in age and in gender composition. Average age in both samples is 7 years and 8 months.
Intelligence test. The RAKIT (Bleichrodt, Drenth, Zaal, & Resing, 1984) is an individually administered Dutch intelligence test for children (aged 4 to 11 years) composed of 12 subtests. RAKIT full scale IQ has been shown to correlate .86 with WISC-R full scale IQ (Bleichrodt et al., 1984). The subtests are Closure, Exclusion, Memory Span, Verbal Meaning, Mazes, Analogies, Quantity, Discs, Learning Names, Hidden Figures, Idea Production, and Storytelling. All instruction texts are in Dutch. Subtests with the largest language component are Verbal Meaning, Analogies, and Storytelling. Although subtest scores are standardized, and may be interpreted separately, the broad measurement aim of the RAKIT is to provide an indication of general mental ability (i.e., IQ), and/or one of four factors, which are composed of the scores on 2 to 6 subtests.
Analyses. Based on Carroll’s (1993) taxonomy, Te Nijenhuis et al. (2004) posited a factor structure with four factors: Hybrid (Gh), Visual (Gv), Memory (Gm), and Retrieval (Gr). This factor model is displayed in Figure 2. [5] Our focus is on the mean group differences on the subtest level, and we investigate whether these are attributable to group differences in the means of the four factors. As most of the RAKIT subtests have a rather strong language component, measurement bias with respect to minority children is a real possibility. In addition, item analyses by Te Nijenhuis et al. indicated that some subtests showed DIF. Despite this, Te Nijenhuis et al. concluded that only one of the subtests (i.e., Verbal Meaning) showed bias that was of any practical concern.

The tenability of strict factorial invariance with respect to groups is investigated by fitting a series of increasingly restrictive models, as presented in Table 1. The tenability of each restriction is judged by differences in fit between the restricted model and the less-restricted model. For instance, Step 2 versus Step 1 involves the tenability of equality of factor loadings. As the successive models are nested (Bollen, 1989), a likelihood ratio test can be used to test each restriction. To assess model fit, and to assess the tenability of across-group restrictions on measurement parameters, we look at exact fit in terms of χ² and degrees of freedom (DF). We also consider the Comparative Fit Index [6] (CFI; Bentler, 1990) and Root Mean Square Error of Approximation (RMSEA; Browne & Cudeck, 1993). Based on their simulation study, Hu and Bentler (1999) suggested that CFI values above .95 and RMSEA values below .06 are indicative of good model fit. Besides these fit measures, we use the AIC for comparing the relative fit of models (cf. Wicherts & Dolan, 2004). The AIC is a fit measure that takes into account the parsimony of models, with lower AIC values indicating better fit. In case a step is accompanied by a clear deterioration in model fit, the particular restriction is rejected. In such cases, modification indices can highlight the particular parameter(s) causing the misfit. A modification index (MI) is a measure of how much chi-square is expected to decrease if a constraint on a given parameter is relaxed, and the model is re-fitted (Jöreskog & Sörbom, 2003). A closer look at the magnitude of MIs of intercepts in Step 4 provides important information about intercept differences between groups. MI values larger than 3.84 indicate that model fit can be improved significantly (p<.05). The LISREL (Jöreskog & Sörbom, 2003) input files and data are available upon request.
Results
Before we test formally for strict factorial invariance with respect to ethnicity in these data, we consider in detail data patterns that in fact suggest that the subtests of the RAKIT may be biased against minorities. Figure 3 displays the effect sizes (Cohen’s d) of the difference between the majority and minority group per subtest. For each subtest, Figure 3 also contains the estimates of factor loadings, as estimated in the majority group without across group-restrictions (i.e., Step 1). In order to illustrate the importance of collinearity of factor loadings and between-group differences, we scaled the factors differently than usual in this analysis (but not in the one described in Table 2). Normally one factor loading per factor is set at 1, but as the restricted value may assume any value, we restricted the highest factor loading for each factor to be identical to the effect size of the corresponding subtest. [7] This enables a comparison for each factor of the effect sizes per subtest in relation to the relative estimates of factor loadings. Recall that measurement invariance requires that mean group differences on the subtests should be collinear with the corresponding factor loading; larger factor loadings should be associated with larger mean differences. If effect sizes and factor loadings per factor are not collinear, this suggests intercept differences (a statistical test of which follows below).

Consider the three subtests loading on the Hybrid factor. Of these subtests Quantity has the highest factor loading and Verbal Meaning the lowest, with the factor loading of Analogies assuming an intermediate value. As is apparent, the effect size of Verbal Meaning is too large (d = 2.26) to be the result of a between-group differences in the mean of the Hybrid factor. If this large mean difference were due to a latent mean difference, the (standardized) factor loading of the Verbal Meaning subtest would have been twice as large as the factor loading of the two other indicators of Hybrid ability. This is clearly not the case because we already know from the analysis of covariance structure in the majority group that this subtest has a factor loading smaller than the other two subtests. There may be several reasons for this result. It is conceivable, yet unlikely, that both the Analogies subtest and the Quantity subtest underestimate the ethnic difference on this factor. This would mean that both subtests are positively biased towards minority children. This explanation appears rather farfetched, because Verbal Meaning is a test measuring vocabulary knowledge and the minority group contains mainly non-native speakers of Dutch. Therefore, by inspecting the mean difference and the factor loadings, we would expect that the mean of the minority group on Verbal Meaning is too low. This suggests that the intercept of this subtest is considerably lower for minority children, and that this test is biased towards minorities.
Now consider very large difference between the effects sizes for the two indicators of the Memory factor, despite the fact that the factor loadings of both these subtests are very similar. Again, the subtest with the largest cultural component (Learning Names) shows the largest between-group difference. That is, the Learning Names subtest contains several Dutch names from various fairy tales, which may be unfamiliar to children of Moroccan or Turkish descent. The difference between the effect sizes of Learning Names and Memory Span are so large that is simply impossible for a single Memory factor to account for this effect. Finally, for the two indicators of the Retrieval factor, the subtest with the lowest factor loading is the Storytelling subtest. However, this subtest shows a larger between-group difference than the less culturally loaded Idea Production subtest. Hence, again, the subtest with the largest between-group difference appears to be biased against minorities.
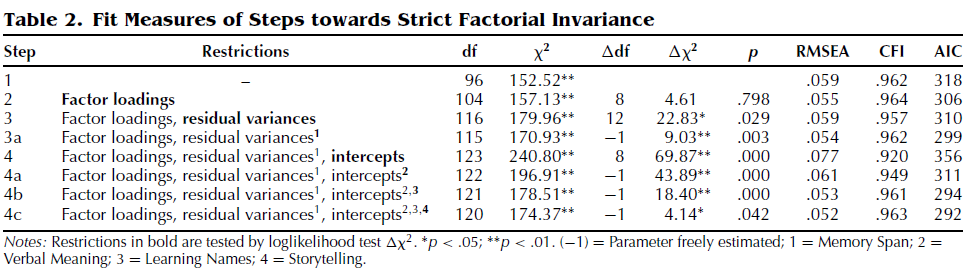
Thus, if we view the pattern of mean differences in light of the pattern of factor loadings based on the covariance structure in the majority group, we see that these patterns are incompatible. This incompatibility is due to between-group differences in intercepts that are indicative of measurement bias. Of course, measurement invariance is investigated statistically by testing the fit of various models that differ with respect to between group constraints on factor loadings, residual variances and intercepts. The fit indices of the different models are reported in Table 2. First, we investigate the comparability of covariance structure (i.e., Steps 1–3). In Step 1, no between-group restrictions are imposed, although the configuration of factor loadings is equal across groups. As can be seen, the baseline model fits well in terms of RMSEA and CFI (cf. Hu & Bentler, 1999). In addition, the values of the Standardized Root Mean Square Residual (SRMR) indicate that the baseline model fits well in both the majority (.054) and the minority group (.062).
In Step 2, the factor loadings are restricted to be equal across both groups. As can be seen, this restriction is accompanied by a nonsignificant increase in chi-square. Moreover, all fit indices improve given this restriction. Therefore, as Te Nijenhuis et al. (2004) established also, factor loadings appear to be invariant across groups.
In Step 3, the residual variances are restricted to be group-invariant. This step is accompanied by a slight deterioration in fit in terms of RMSEA, CFI, and AIC. In addition, the likelihood ratio test shows that this restriction appears untenable. A closer look at the modification indices shows that this misfit is mainly due to the residual variance of Memory Span (MI = 9). Indeed, freeing this parameter (Step 3a), leads to an improvement in model fit as can be seen by the significant decrease in chi-square, and improvements in RMSEA, CFI, and AIC. In the majority group this residual variance is smaller (18.41, SE = 2.32) than in the minority group (31.48, SE = 4.19).
In Step 4, the intercepts are restricted to be equal across groups, while at the same time allowing a difference in the four factor means. As can be seen in Table 2, this restriction is accompanied by a clear drop in model fit. The increase in chi-square is highly significant, the RMSEA increases well above the cut-off for good fit, the CFI drops below .95, and the AIC is relatively large. As we already expected by visual inspection of Figure 3, mean subtest differences between the groups cannot be explained solely in terms of group differences in the means of the factors. Clearly, there are intercept differences between the groups.
A further look at the modification indices indicates that the intercepts of the following subtests differ across groups: Verbal Meaning (MI = 40), Learning Names (MI = 15), and Storytelling (MI = 5). Indeed, if we allow between-group differences in these parameters, the model fit (in Models 4a to 4c) improves considerably. In all cases, the intercepts in the minority group are lower, indicating uniform bias with respect to this group.

One might ask whether these intercept differences are serious: that is, do they represent substantial, rather than just statistically significant, effects? Under the assumption that the remaining subtests are not biased, we can estimate the factor mean difference across groups. The multiplication of the factor loading with this factor mean difference provides the expected mean difference of the subtest (cf. Table 3) (see also Scholderer, Grunert, & Brunso, 2005). By comparing this expected mean to the mean difference actually obtained, we get the following underestimations due to intercept differences per subtest: Verbal Meaning: 6.89, Learning Names: 5.12, and Storytelling: 1.79. For the total score, this means an underestimation of 13.8 points, which according to the transformation table in the test manual (Bleichrodt et al., 1984, p. 128) represents an underestimation of the total IQ of 7 IQ points, or a little less than half a SD.
Conclusion
By not testing for intercept differences, Te Nijenhuis et al. (2004) overlooked the fact that at least three of the twelve subtests in the RAKIT are biased against 7-year-olds of Moroccan and Turkish descent. [8] These substantial intercept differences suggest that the RAKIT is not suitable for the assessment of minority 7-year-olds. A further analysis (available upon request) of the data of Surinamese and Antillean children of the same age (at least 4.5 IQ points underestimation), and of children aged 5 and 9, gave similar results. Although the biasing effects for the other minority groups were less serious, the underestimation of ability was still large enough to render the RAKIT unsuitable for use with these minorities. Even an underestimation of a few IQ points may have serious consequences. For instance, the Dutch Ministry of Education uses explicit cut-off IQ values (e.g., 70 or 85) for the selection of children for special education. An underestimation of the size we found for the children of Moroccan and Turkish may result in wrong selection decisions. Although we would advise against use of the RAKIT in these immigrant groups for such purposes, a practical solution would be to discount the biased subtests. Alternatively, the intercept differences we found across groups may be used to correct upwards the subtest scores for these immigrant groups.
Discussion
It is unfortunate that in many applications measurement invariance is assumed to hold without testing for the equality over groups of measurement intercepts. Our present aims were to show why a test of the equality of measurement intercepts across groups is essential for measurement invariance, what group differences in intercepts may mean, and how these differences can be detected. If the intercept of a particular subtest is different across groups, this implies that between-group differences on this subtest cannot be solely due to between-group differences in the construct(s) that the subtest is supposed to measure. In other words, an intercept difference indicates measurement bias in the sense that there are one or more construct-irrelevant variables causing group differences in test scores. The importance of studying intercept differences was illustrated by a re-analysis of a study into the appropriateness of a Dutch intelligence test for minority children. The results indicated the presence of rather strong measurement bias, which was not fully appreciated in the original study, despite the fact that the analyses in that study appeared quite thorough.
It may be argued that the requirement of identical measurement intercepts over groups is too stringent, and will prove to be too restrictive in most data analyses. However, intercept differences do not render test scores completely incomparable across groups. Quite to the contrary, intercept differences may be taken into account, their size may be estimated (provided that there remain sufficient invariant indicators), and they may provide valuable information on the nature of between-group differences in test scores in many applications.
The seriousness of intercept differences depends on the measurement aim. If we allow for intercept differences, we also allow for group differences in the mean of the specific ability tapped by an indicator. Note that such an effect may or may not be due to DIF at the item level, which should be studied separately. A further issue refers to the size of intercept differences one is willing to accept (Borsboom, 2006). Again, it depends on the use of the test. Fortunately, as we showed in our empirical example, the effect size of such bias is easily computed provided that the remaining indicators of a factor are unbiased. In our example, the effects of bias could be directly related to its effect on IQ scores, which enabled the expression of bias in terms of IQ points. In most applications, effect size estimates can be readily computed and related to the effects on norm scores.
Psychological tests of various kinds are used in countless applied settings. Many of these tests are either developed with a particular factor structure in mind (e.g., WISC-IV, WAIS-III), or are amenable to investigation by CFA. There is general agreement that test scores should not be affected by irrelevant characteristics attached to the membership of demographic groups. We have argued that if the measurement aim is related to broad latent ability factors, then the requirement of fairness also relates to the subtest level. This implies that in broad multivariate tests (e.g., intelligence battery), the invariance of subtests’ intercepts should also be studied. Therefore, detecting intercept differences between groups should be an essential part of the validation of tests.
Notes
[1] To ease presentation, we focus on the single common factor model in two samples. The elaboration to multiple-factor analysis in more than two samples is straightforward (cf. Bollen, 1989; Dolan, 2000; Lubke et al., 2003a).
[2] The statistical test of equality of intercepts is simply conducted by testing a model with group-invariant intercepts, while allowing for between-group differences in factor means (cf. Table 1, Step 4). It is crucial to assess the fit of equality of intercepts while allowing for differences in factor means (Meredith, 1993). The reason for this is simply that if there is any between-group difference in factor mean, and we would not allow for this possibility, this (latent) source of mean difference would be forced into differences in intercepts. This is equivalent to the requirement that a test of factor loadings must allow for between-group differences in factor (co)variances (Meredith, 1993). Whether or not groups differ with respect to factor means or factor (co)variances is not a matter of measurement invariance.
[3] Note that the current scenario with one-factor, simple structure (i.e., each subtest loading on only one factor) enables a straightforward interpretation of the relation between factor loadings and manifest between-group differences. When an indicator loads on two or more factors (i.e., no simple structure), the between-group difference on this indicator is a function of possible intercept differences and all between-group differences on these factors.
[4] It is important to stress that a common factor is defined within a particular factor model. It is quite possible that a subtest shows an intercept difference when it loads on one factor, but not when it loads on another factor in another model. Of course, the character of a factor depends on its indicators. Reasons for intercept differences are not a characteristic of subtests per se, but of a characteristic of subtest scores as they relate to the common factor(s).
[5] This factor model differs from the model that corresponds to the four factors in the manual (Bleichrodt et al., 1984). Using this alternative factor model to assess measurement invariance gave quite similar results.
[6] Widaman and Thompson (2003) have argued that because of the nesting of models it is inappropriate to employ the standard null model within the MGCFA context with mean structure. Therefore, we use a model without any factor structure, in which intercepts and residual variances are restricted to be group invariant (i.e., model 0A in Widaman & Thompson, 2003) as the null model in computing the CFI values.
[7] Note that, because of this choice, the comparability of factor loading estimates across different factors is lost. Note also that the subtest scores reported are standardized norm scores. Hence, SDs are equal across subtests.
[8] Te Nijenhuis et al. (2004) did notice the problems with Verbal Meaning, but missed the bias on Learning Names and Storytelling. The combined bias on the latter two subtests constitutes an underestimation of 3.5 IQ points or about 0.25 SD units.
